Quantcast
Channel: Severalnines - MySQL
Viewing all 568 articles
Browse latest View live

Connection Handling & Throttling with ProxySQL

$
0
0

The ability to shape the traffic that goes to the database is one of the most important ones. In the past days you had not that much control over it - applications sent the traffic to the database and that’s about it. HAProxy, which was commonly used, also does not have an option for fine-grained control over the traffic. With the introduction of the SQL-aware proxies, like ProxySQL, more possibilities became available for database administrators. Let’s take a look at the connection handling and throttling possibilities in ProxySQL.

Connection Handling in ProxySQL

As you may know, the way ProxySQL works is through the query rules. It is a list of rules that every query is tested against and that govern exactly how the ProxySQL will handle the query. Starting from the beginning, the application connects to ProxySQL. It will authenticate against ProxySQL (this is why ProxySQL has to store all users and password hashes) and then ProxySQL will run it through the query rules to determine to which hostgroup the query should be sent to.

ProxySQL opens a pool of connections to the backend servers. It is not 1-to-1 mapping, by default it tries to reuse one backend connection for as many frontend connections as possible. This is called connection multiplexing. Details depend on the exact traffic that it has to handle. Every open transaction has to be handled within the same connection. If there is some kind of a local variable defined, this connection cannot be reused. Being able to reuse single backend connection by multiple frontend connections reduces significantly the burden on the backend database.

Once the connection is made to the ProxySQL, as we mentioned before, it will be processed according to the query rules. Here the traffic shaping may take place. Let’s take a look at the options

Connection Throttling in ProxySQL

First, let’s just drop all the SELECTs. We are running our “application”, Sysbench, in following manner:

root@vagrant:~# sysbench /root/sysbench/src/lua/oltp_read_only.lua --threads=4 --events=200 --time=0 --mysql-host=10.0.0.101 --mysql-user=sbtest --mysql-password=sbtest --mysql-port=6033 --tables=32 --report-interval=1 --skip-trx=on --table-size=100000 --db-ps-mode=disable --rate=10 run

sysbench 1.1.0-bbee5d5 (using bundled LuaJIT 2.1.0-beta3)


Running the test with following options:

Number of threads: 4

Target transaction rate: 10/sec

Report intermediate results every 1 second(s)

Initializing random number generator from current time


Initializing worker threads...


Threads started!


[ 1s ] thds: 4 tps: 5.97 qps: 103.49 (r/w/o: 103.49/0.00/0.00) lat (ms,95%): 244.38 err/s: 0.00 reconn/s: 0.00

[ 1s ] queue length: 0, concurrency: 4

[ 2s ] thds: 4 tps: 13.02 qps: 181.32 (r/w/o: 181.32/0.00/0.00) lat (ms,95%): 580.02 err/s: 0.00 reconn/s: 0.00

[ 2s ] queue length: 5, concurrency: 4

[ 3s ] thds: 4 tps: 14.99 qps: 228.81 (r/w/o: 228.81/0.00/0.00) lat (ms,95%): 669.89 err/s: 0.00 reconn/s: 0.00

[ 3s ] queue length: 1, concurrency: 4

[ 4s ] thds: 4 tps: 16.99 qps: 232.88 (r/w/o: 232.88/0.00/0.00) lat (ms,95%): 350.33 err/s: 0.00 reconn/s: 0.00

[ 4s ] queue length: 0, concurrency: 3

[ 5s ] thds: 4 tps: 8.99 qps: 99.91 (r/w/o: 99.91/0.00/0.00) lat (ms,95%): 369.77 err/s: 0.00 reconn/s: 0.00

[ 5s ] queue length: 0, concurrency: 1

[ 6s ] thds: 4 tps: 3.99 qps: 55.81 (r/w/o: 55.81/0.00/0.00) lat (ms,95%): 147.61 err/s: 0.00 reconn/s: 0.00

[ 6s ] queue length: 0, concurrency: 1

[ 7s ] thds: 4 tps: 11.06 qps: 162.89 (r/w/o: 162.89/0.00/0.00) lat (ms,95%): 173.58 err/s: 0.00 reconn/s: 0.00

[ 7s ] queue length: 0, concurrency: 2

[ 8s ] thds: 4 tps: 7.99 qps: 112.88 (r/w/o: 112.88/0.00/0.00) lat (ms,95%): 200.47 err/s: 0.00 reconn/s: 0.00

[ 8s ] queue length: 0, concurrency: 2

[ 9s ] thds: 4 tps: 9.01 qps: 110.09 (r/w/o: 110.09/0.00/0.00) lat (ms,95%): 71.83 err/s: 0.00 reconn/s: 0.00

[ 9s ] queue length: 0, concurrency: 0

[ 10s ] thds: 4 tps: 9.99 qps: 143.87 (r/w/o: 143.87/0.00/0.00) lat (ms,95%): 153.02 err/s: 0.00 reconn/s: 0.00

[ 10s ] queue length: 0, concurrency: 1

[ 11s ] thds: 4 tps: 12.02 qps: 177.28 (r/w/o: 177.28/0.00/0.00) lat (ms,95%): 170.48 err/s: 0.00 reconn/s: 0.00

[ 11s ] queue length: 0, concurrency: 1

[ 12s ] thds: 4 tps: 5.00 qps: 70.95 (r/w/o: 70.95/0.00/0.00) lat (ms,95%): 231.53 err/s: 0.00 reconn/s: 0.00

[ 12s ] queue length: 0, concurrency: 2

[ 13s ] thds: 4 tps: 10.00 qps: 137.01 (r/w/o: 137.01/0.00/0.00) lat (ms,95%): 223.34 err/s: 0.00 reconn/s: 0.00

[ 13s ] queue length: 0, concurrency: 1

[ 14s ] thds: 4 tps: 11.01 qps: 143.14 (r/w/o: 143.14/0.00/0.00) lat (ms,95%): 130.13 err/s: 0.00 reconn/s: 0.00

[ 14s ] queue length: 0, concurrency: 0

[ 15s ] thds: 4 tps: 5.00 qps: 100.99 (r/w/o: 100.99/0.00/0.00) lat (ms,95%): 297.92 err/s: 0.00 reconn/s: 0.00

[ 15s ] queue length: 0, concurrency: 4

[ 16s ] thds: 4 tps: 10.98 qps: 122.82 (r/w/o: 122.82/0.00/0.00) lat (ms,95%): 344.08 err/s: 0.00 reconn/s: 0.00

[ 16s ] queue length: 0, concurrency: 0

[ 17s ] thds: 4 tps: 3.00 qps: 59.01 (r/w/o: 59.01/0.00/0.00) lat (ms,95%): 287.38 err/s: 0.00 reconn/s: 0.00

[ 17s ] queue length: 0, concurrency: 2

[ 18s ] thds: 4 tps: 13.01 qps: 165.14 (r/w/o: 165.14/0.00/0.00) lat (ms,95%): 173.58 err/s: 0.00 reconn/s: 0.00

[ 18s ] queue length: 0, concurrency: 0

[ 19s ] thds: 4 tps: 6.99 qps: 98.79 (r/w/o: 98.79/0.00/0.00) lat (ms,95%): 253.35 err/s: 0.00 reconn/s: 0.00

[ 19s ] queue length: 0, concurrency: 1

[ 20s ] thds: 4 tps: 9.98 qps: 164.60 (r/w/o: 164.60/0.00/0.00) lat (ms,95%): 590.56 err/s: 0.00 reconn/s: 0.00

[ 20s ] queue length: 0, concurrency: 3

SQL statistics:

    queries performed:

        read:                            2800

        write:                           0

        other:                           0

        total:                           2800

    transactions:                        200    (9.64 per sec.)

    queries:                             2800   (134.89 per sec.)

    ignored errors:                      0      (0.00 per sec.)

    reconnects:                          0      (0.00 per sec.)


Throughput:

    events/s (eps):                      9.6352

    time elapsed:                        20.7573s

    total number of events:              200


Latency (ms):

         min:                                   44.36

         avg:                                  202.66

         max:                                  726.59

         95th percentile:                      590.56

         sum:                                40531.73


Threads fairness:

    events (avg/stddev):           50.0000/0.71

    execution time (avg/stddev):   10.1329/0.05

It is a fully read-only traffic, it should average in 10 transactions (140 queries) per second. As those are only SELECTs, we can easily modify one of the existing query rules and block the traffic:

This will result in following error on the application side:

root@vagrant:~# sysbench /root/sysbench/src/lua/oltp_read_only.lua --threads=4 --events=200 --time=0 --mysql-host=10.0.0.101 --mysql-user=sbtest --mysql-password=sbtest --mysql-port=6033 --tables=32 --report-interval=1 --skip-trx=on --table-size=100000 --db-ps-mode=disable --rate=10 run

sysbench 1.1.0-bbee5d5 (using bundled LuaJIT 2.1.0-beta3)


Running the test with following options:

Number of threads: 4

Target transaction rate: 10/sec

Report intermediate results every 1 second(s)

Initializing random number generator from current time


Initializing worker threads...


Threads started!


FATAL: mysql_drv_query() returned error 1148 (SELECT queries are not allowed!!!) for query 'SELECT c FROM sbtest25 WHERE id=83384'

FATAL: `thread_run' function failed: /usr/local/share/sysbench/oltp_common.lua:426: SQL error, errno = 1148, state = '42000': SELECT queries are not allowed!!!

Now, this is obviously harsh. We can be more polite and just increase delay for the SELECT queries.

This, obviously, impacts the performance of the queries as 10 milliseconds are added to every SELECT that is executed. 

SQL statistics:

    queries performed:

        read:                            2800

        write:                           0

        other:                           0

        total:                           2800

    transactions:                        200    (5.60 per sec.)

    queries:                             2800   (78.44 per sec.)

    ignored errors:                      0      (0.00 per sec.)

    reconnects:                          0      (0.00 per sec.)


Throughput:

    events/s (eps):                      5.6030

    time elapsed:                        35.6952s

    total number of events:              200


Latency (ms):

         min:                                  622.04

         avg:                                 7957.01

         max:                                18808.60

         95th percentile:                    15934.78

         sum:                              1591401.12


Threads fairness:

    events (avg/stddev):           50.0000/36.01

    execution time (avg/stddev):   397.8503/271.50

We set up delays for every SELECT query, which does not necessarily make any sense other than showing that you can do it. Typically you would like to use the delay on some offending queries. Let’s say we have a query that is very heavy and it adds significant load on the database’s CPU. What’s worse, it has been introduced by recent code change and it comes from all of the application hosts. Sure, you can wait for the developers to revert the change or push a fix but with ProxySQL you can take the control in your own hands and just either block the query or reduce its impact even quite significantly.

Let’s assume that our database is moving on nicely when alarm bells start to ring.

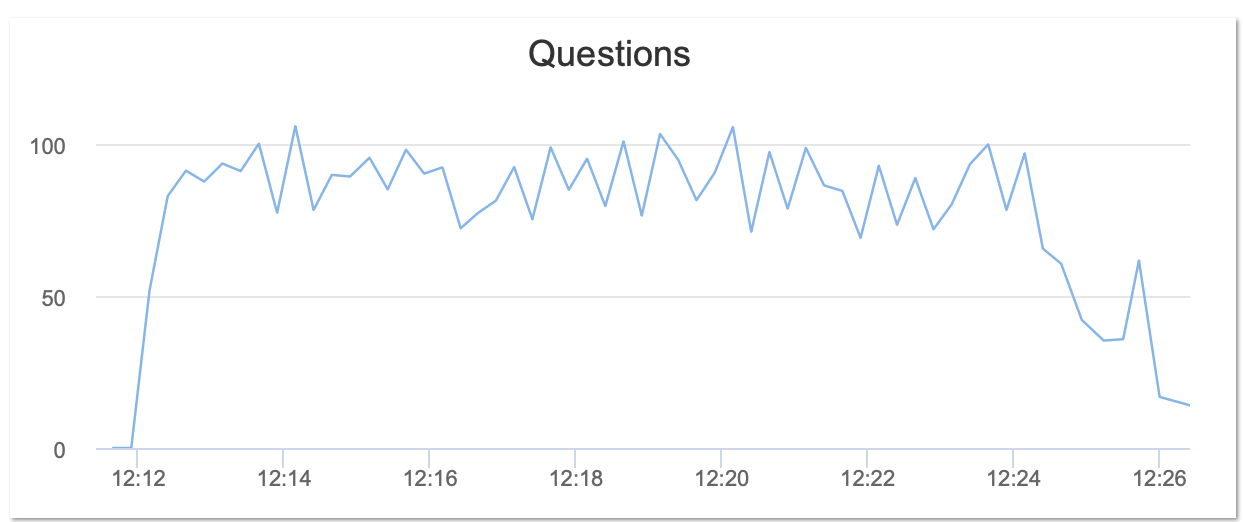
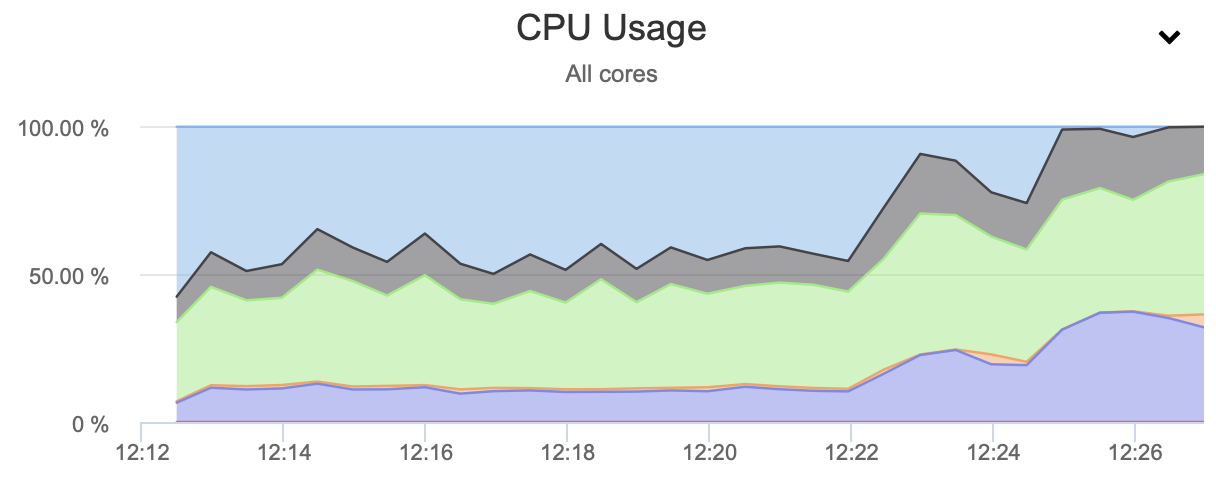
A quick look at the metrics tells us that the number of queries executed by ProxySQL goes down while CPU utilization goes up. We can look at the Top Queries in ProxySQL to see if we can notice something unusual.

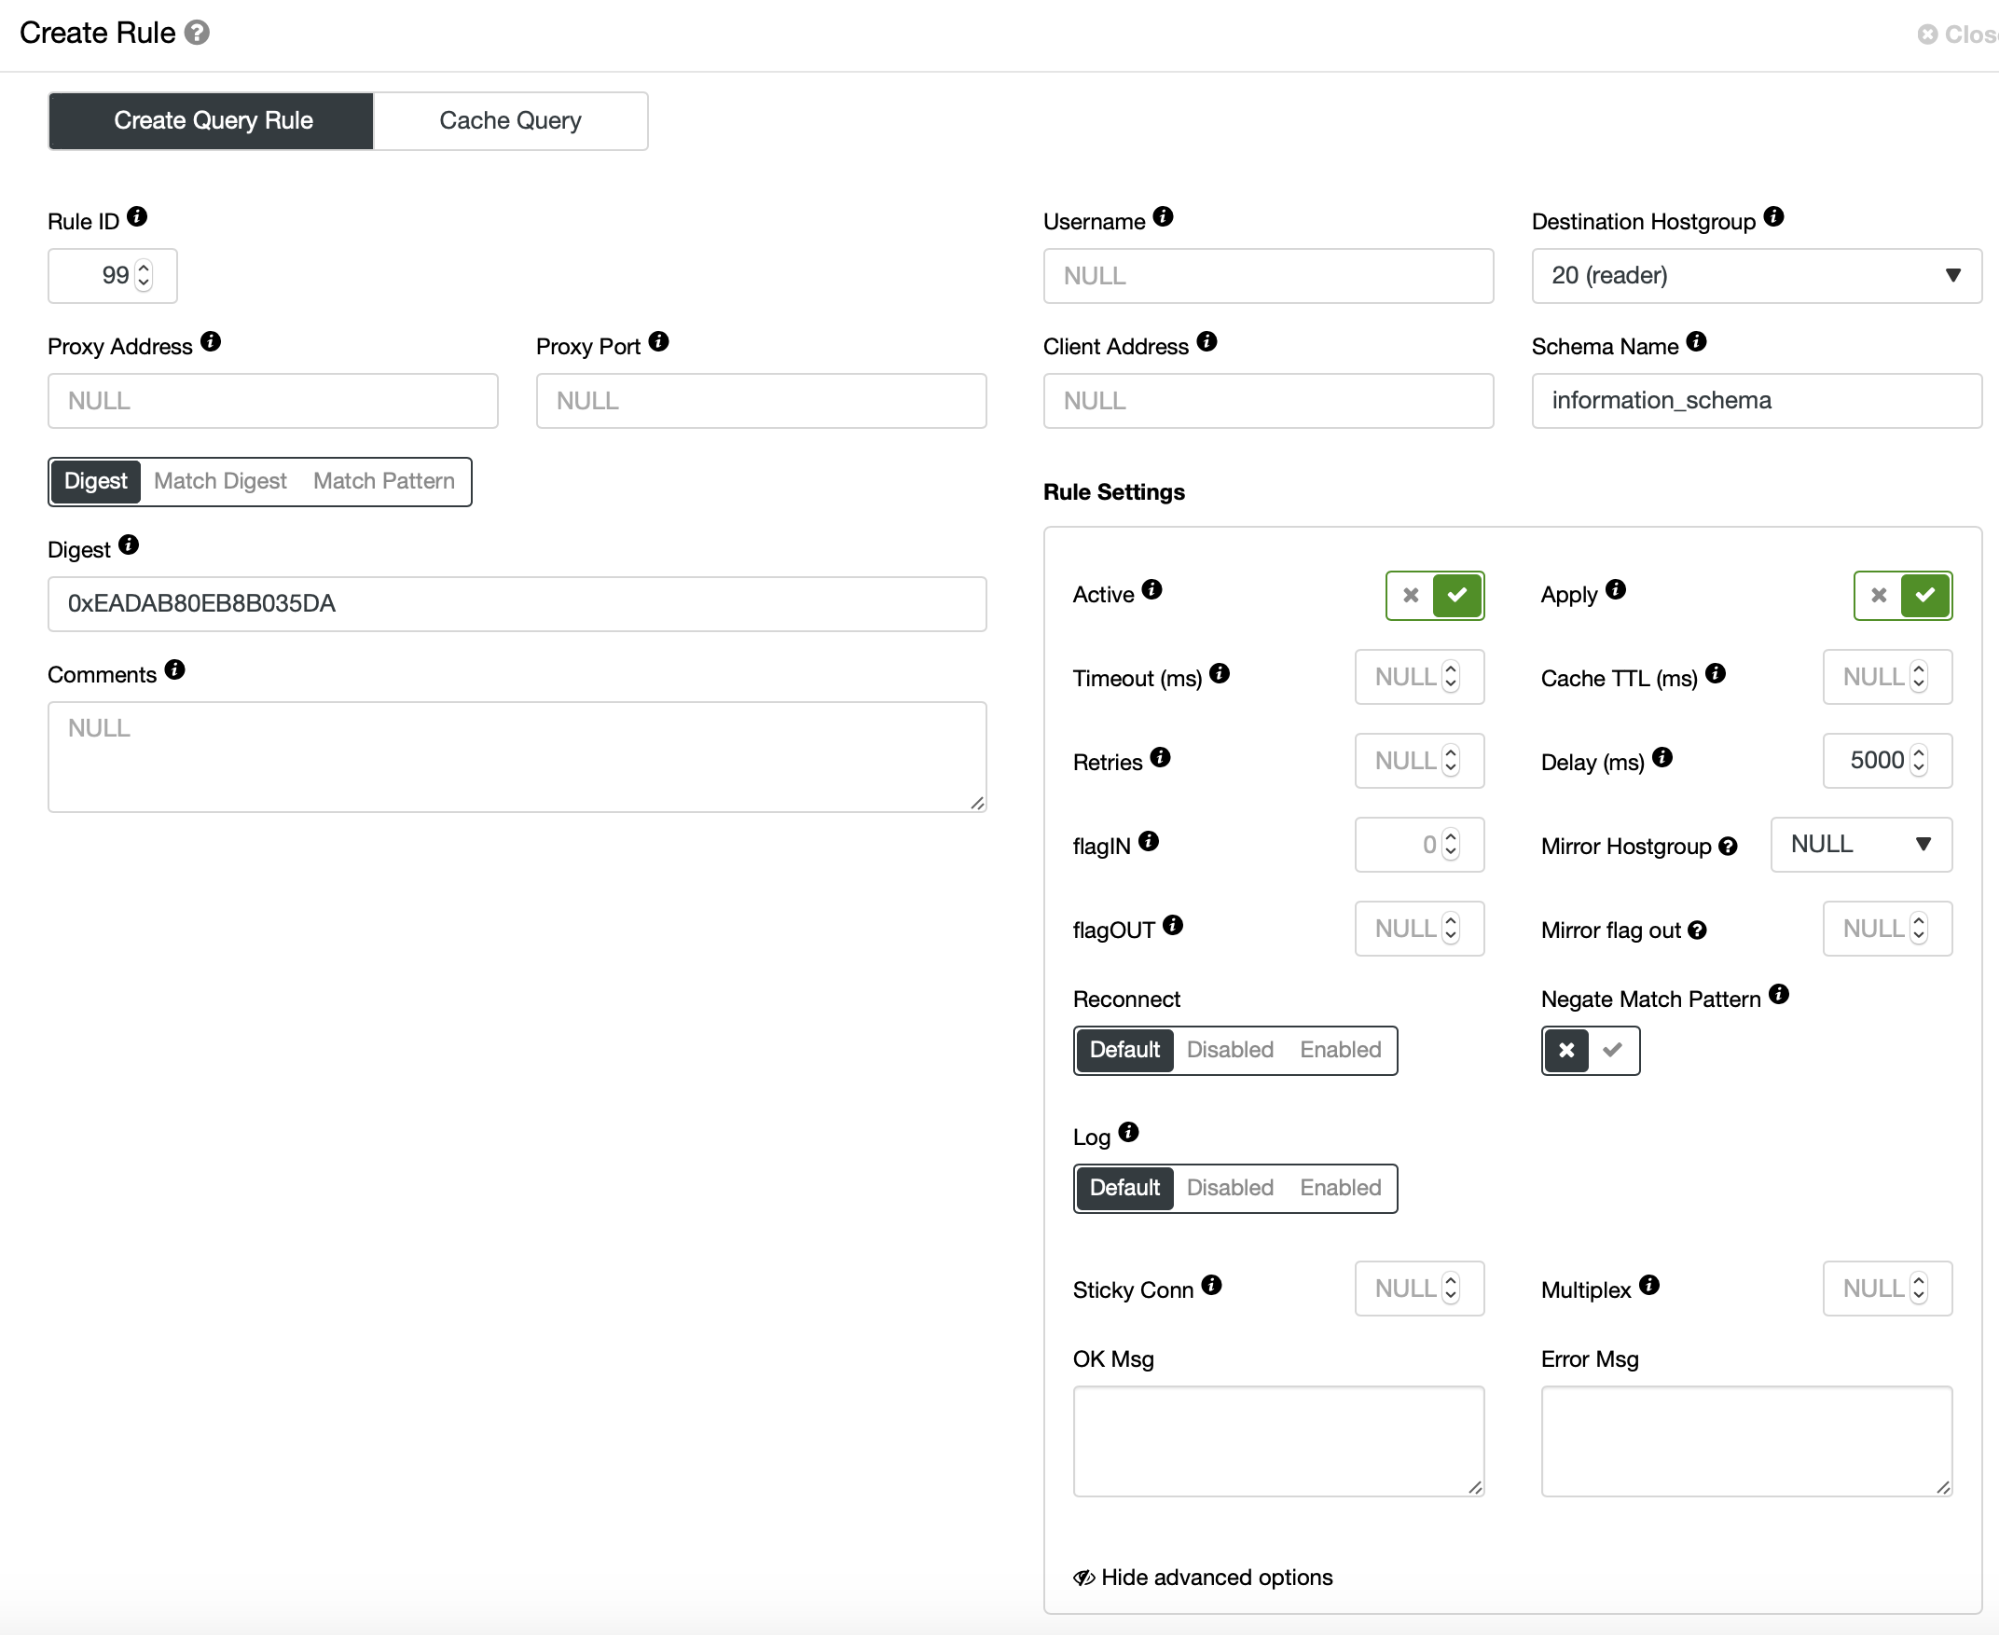
Unusual it is indeed - a new query that is not a part of the regular query mix we observed on our system. We can use the option to create the query rule.

We will add a 50 second delay to the query by setting Delay to 50000 ms.

We can confirm that the query rule is in use and queries are hitting it.

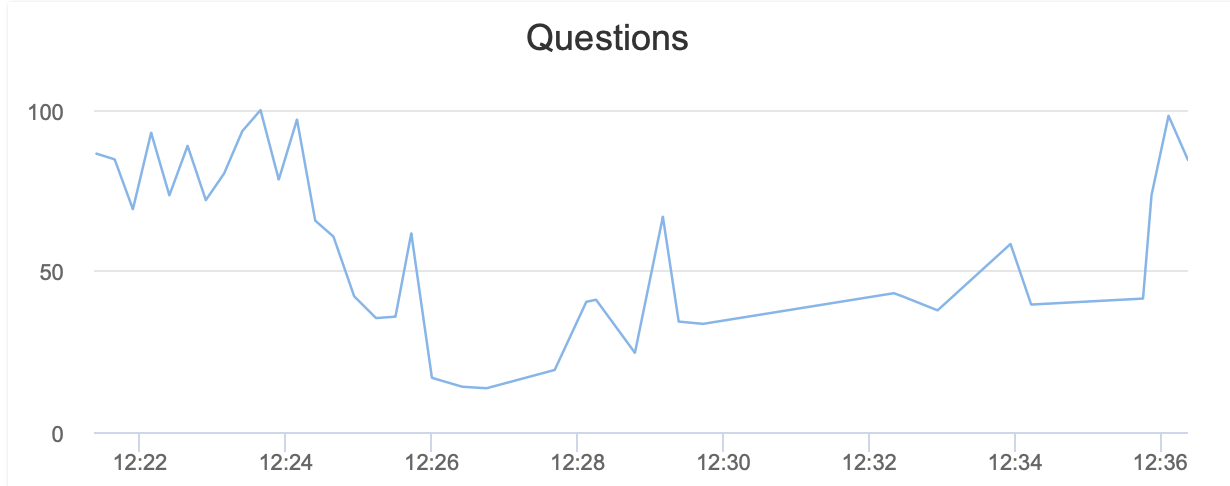
After a short while we can also notice that the load drops and the number of queries executed is again in the expected range. Of course, instead of adding the delay to the query we could just simply block it. That would have been even easier for us to accomplish but totally blocking the query may come with significant impact on the application.

We hope this short blog post gives you some insight into how ProxySQL can help you to shape your traffic and reduce the performance hit introduced by runaway queries.


Understanding the HAProxy Statistics for MySQL & PostgreSQL

$
0
0

Having a Load Balancer is always a good option to improve your database environment. It can help you on redirect applications to available database nodes, distribute the traffic across multiple servers to improve performance, or even failover when required. In order to know what is happening with your traffic/system, you need to have a good monitoring system in place to monitor not only your database nodes but also your Load Balancers, to take proactive or reactive actions to mitigate any current or future issue. To be able to find an issue, you need to understand what each value that you are seeing means.

In this blog, we will explain what the HAProxy statistics mean and how to monitor it in a friendly way using graphs and ClusterControl.

What is HAProxy?

HAProxy is an open-source proxy that can be used to implement high availability, load balancing, and proxying for TCP and HTTP based applications.

As a load balancer, HAProxy distributes traffic from one origin to one or more destinations and can define specific rules and/or protocols for this task. If any of the destinations stops responding, it is marked as offline, and the traffic is sent to the rest of the available destinations.

HAProxy Node Types

When you configure your HAProxy Load Balancer, there are different node types to configure depending on the functionality you want. The options are Frontend, Backend, and Listen.

Frontend Nodes

When you place HAProxy as a reverse proxy in front of your backend servers, a frontend section in the configuration file defines the IP addresses and ports that clients can connect to. The requests enter the load balancer, and the responses are returned to the client. They pass through the frontend.

frontend site1.com

     bind 10.10.10.150:80

     use_backend api_servers if { path_beg /api/ }

     default_backend web_servers

Backend Nodes

It defines a group of servers that will be load balanced and assigned to handle requests, depending on the policy selected. HAProxy sends requests to a backend and then receives a response from one of the active servers. 

backend web_servers

     balance roundrobin

     cookie SERVERUSED insert indirect nocache

     option httpchk HEAD /

     default-server check maxconn 20

     server server1 10.10.10.151:80 cookie server1

     server server2 10.10.10.152:80 cookie server2

Listen Nodes

It combines the two HAProxy node types that we mentioned above. You may prefer the readability gained by having separate frontend and backend sections, or maybe you want to have a more concise configuration, using the listen approach.

listen  haproxy_10.10.10.143_3307_rw

        bind *:3307

        mode tcp

        tcp-check connect port 9200

        timeout client  10800s

        timeout server  10800s

        balance leastconn

        option httpchk

        default-server port 9200 inter 2s downinter 5s rise 3 fall 2 slowstart 60s maxconn 64 maxqueue 128 weight 100

        server 10.10.10.139 10.10.10.139:3306 check

        server 10.10.10.140 10.10.10.140:3306 check backup

        server 10.10.10.141 10.10.10.141:3306 check backup

HAProxy Stats Page

HAProxy allows you to enable a stats page with real-time information to see what is happening in your Load Balancer. To enable the statistics page, you just need to use the “stats enable” directive in your HAProxy configuration file (/etc/haproxy/haproxy.cfg). Let’s see an example:

userlist STATSUSERS

        group admin users admin

        user admin insecure-password admin

        user stats insecure-password admin


listen admin_page

        bind *:9600

        mode http

        stats enable

        stats refresh 60s

        stats uri /

        acl AuthOkay_ReadOnly http_auth(STATSUSERS)

        acl AuthOkay_Admin http_auth_group(STATSUSERS) admin

        stats http-request auth realm admin_page unless AuthOkay_ReadOnly

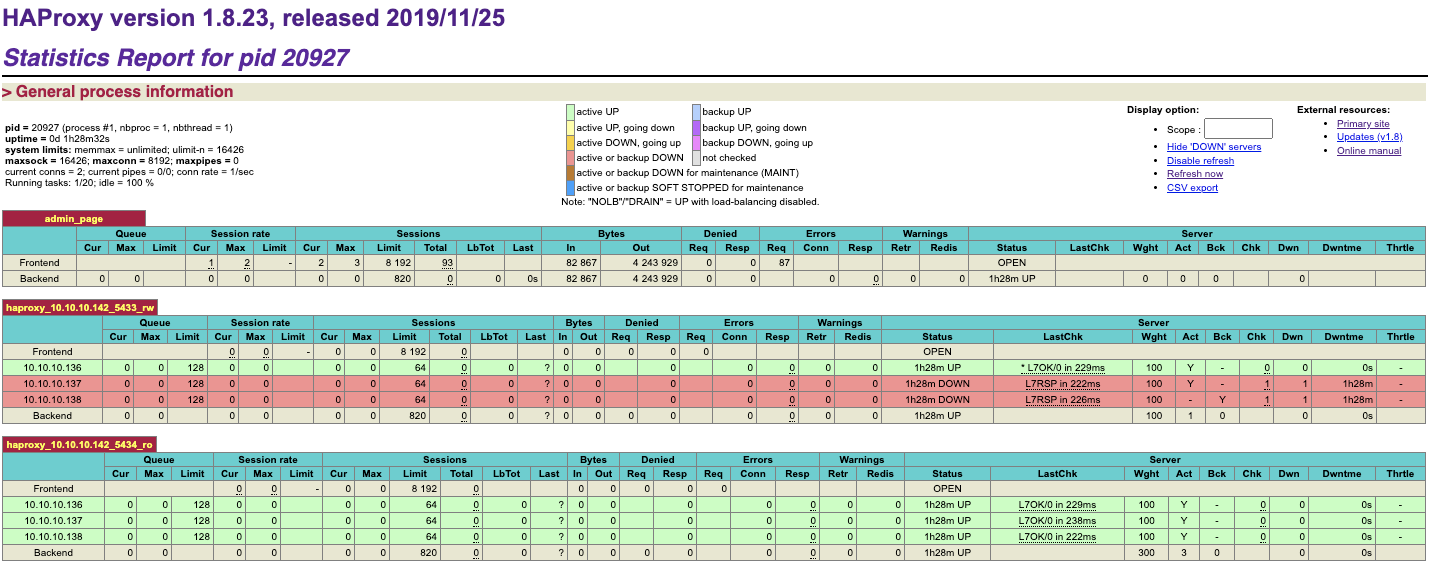
The bind line sets which IP address and port you will use to access the stats page. You can also configure authentication and a refresh period. If you access your HAProxy node using the specified port (9600 in the example), admin/admin credentials, you will see something like this:

Here, you will find different useful metrics to monitor your HAProxy node.

HAProxy Statistics

Now, let’s see what these metrics are. As the meaning depends on the context, we will split it into Frontend and Backend.

Queue

Backend

This section applies only to backends and shows how long clients are waiting for a server to become available. HAProxy is able to queue connections when you use the maxconn setting.  

The “Cur” column shows the number of client connections that are currently queued and not yet assigned to a server. The “Max” column shows the most connections that have ever been queued at once. The “Limit” column shows the maximum number of connections that are allowed to be queued, as defined by the maxqueue setting on each server line in the configuration file.

Session Rate

Frontend

Describes the rate at which clients are connecting to HAProxy. 

The “Cur” column shows the current rate at which client sessions, or fully established connections between client and server, are being created. If you hover your mouse over this field, the page displays the following metrics:

  • Current connection rate: The rate at which clients are connecting to HAProxy.
  • Current session rate:  The rate at which sessions, which are entities that hold the state of an end-to-end connection, are being created.
  • Current request rate: The rate at which HTTP requests are being received over established connections.

The “Max” column shows the most sessions that have ever been in use simultaneously. If you hover your mouse over this field, the page displays the following metrics:

  • Max connection rate: The highest rate at which clients have connected to HAProxy.
  • Max session rate: The highest rate at which clients have established sessions, which are entities that hold the state of an end-to-end connection.
  • Max request rate: The highest rate at which HTTP requests have been received over established connections.

The “Limit” column shows the maximum number of sessions per second that the frontend will accept, as set by the rate-limit sessions setting. If this limit is exceeded, additional connections are kept pending in the socket’s backlog.

Backend

These statistics show the rate at which connections are being made to a server.

The “Cur” column shows the current rate, per second, at which connections are being established to the server. The “Max” column shows the highest rate at which connections have ever been established to the given server. The “Limit” column is not used here.

Sessions

Frontend

This section counts the number of sessions, or full client-to-server connections, in use on the load balancer.

The “Cur” column shows the current number of established sessions. The “Max” column shows the most sessions that have ever been simultaneously established. The “Limit” column shows the most simultaneous sessions that are allowed, as defined by the maxconn setting in the frontend. That particular frontend will stop accepting new connections when this limit is reached. If maxconn is not set, then “Limit” is the same as the maxconn value in the global section of your configuration. If that isn’t set, the value is based on your system. When you hover over the “Total” column, the page displays the following metrics:

  • Cum. connections: Cumulative number of connections established since HAProxy was last reloaded.
  • Cum. sessions: Cumulative number of sessions (end-to-end connections) established since the last reload.
  • Cum. HTTP requests: Cumulative number of HTTP requests since the last reload.
  • HTTP xxx responses: Total number of HTTP requests that received an xxx response.
  • Compressed 2xx: Total number of 2xx responses that were compressed, if compression has been enabled. It also shows the percentage of requests that were compressed.
  • Other responses: Total number of HTTP requests that received a response not covered by the other metrics.
  • Intercepted requests: Total number of requests intercepted and redirected to the HAProxy Stats page.

The “LbTot” and “Last” columns are not used in this section.

Backend

This section shows the number of current connections to any of the active servers.

The “Cur” column lists the number of active connections to a server. The “Max” column shows the most connections that have ever been simultaneously established to the given server. The “Limit” column shows the maximum number of connections allowed for a server, as set by the maxconn parameter on a server line.

The backend row shows the value of fullconn for “Limit” or, if not set, it uses the following formula: Sum of the Sessions Limit values for frontends that route to this backend, divided by 10. The “Total” column shows the cumulative number of connections that have used the given server. When you hover over this field, the page displays the following metrics:

  • Cum. sessions: Cumulative number of connections established to this server.
  • Cum. HTTP responses: Cumulative number of HTTP responses received from this server.
  • HTTP xxx responses: Total number of HTTP xxx responses from this server.
  • Other responses: Total number of HTTP responses not covered by the other metrics.
  • Queue time: The amount of time in milliseconds that a connection stayed queued while waiting for a connection slot to the server, averaged over the last 1024 successful connections.
  • Connect time: The amount of time in milliseconds it took to successfully connect to the server, averaged over the last 1024 successful connections.
  • Response time: The server response time in milliseconds, averaged over the last 1024 successful connections.
  • Total time: The total session time in milliseconds, averaged over the last 1024 successful connections.

The “LbTot” column shows the total number of times the given server was selected to serve a request. This can be due to normal load balancing or because of a redispatch from a failed server. The “Last” column shows the time since the last connection was received.

Bytes

Frontend

This section displays the cumulative amount of data sent and received between HAProxy and clients. The “In” column shows the total number of bytes received and the “Out” column shows the total number of bytes sent.

Backend

This section displays the amount of data sent and received between HAProxy and the server. The “In” column shows the number of bytes sent to the server. The “Out” column shows the number of bytes received back.

Denied

It shows the number of requests and responses that were rejected because of security concerns in both the Frontend and the Backend sections.

Frontend

The “Req” column shows the number of requests that were denied due to configuration directives (http-request deny, http-request reject, etc) placed in the Frontend or Listen section.

The “Resp” column shows the number of responses that were denied by an http-response deny directive that was placed in a frontend or listen.

Backend

The “Req” column only applies to the backend as a whole. It shows the number of requests that were rejected by configuration directives (http-request deny, http-request reject, etc) in a backend.

The “Resp” column shows the number of responses that were rejected for any given server due to http-response deny or tcp-response content reject configuration directives in a backend.

Errors

Frontend

Only the “Req” column is used here. It shows the number of requests that encountered an error.

Possible causes include:

  • Early termination from the client
  • A read error from the client
  • The client timed out
  • The client closed the connection
  • The client sent a malformed request
  • The request was tarpitted

Backend

It shows the number of errors related to communicating with a backend server.

The “Req” column is not used. The “Conn” column shows the number of requests that encountered an error while trying to connect to the server. The “Resp” column shows errors encountered while getting the response.

Warnings

Backend

Only for backends. This section displays the number of retries and redispatches. If you’ve added a retries directive to your backend, then the “Retr” column shows the total number of times that a connection was retried. The “Redis” column shows the number of times that HAProxy failed to establish a connection to a server and redispatched it to another server. This requires that you’ve added an option redispatch directive.

Server

Frontend

The only field from this section that applies to a frontend is the Status field. When Status is OPEN, the frontend is operating normally and ready to receive traffic. 

Backend

This section shows details about the status, health, and weight of each server. The “Status” column displays if the server is currently up and for how long. It can display any of the following statuses:

  • UP: The server is reporting as healthy.
  • DOWN: The server is reporting as unhealthy and unable to receive requests.
  • NOLB: You’ve added http-check disable-on-404 to the backend and the health checked URL has returned an HTTP 404 response.
  • MAINT: The server has been disabled or put into maintenance mode.
  • DRAIN: The server has been put into drain mode.
  • no check: Health checks are not enabled for this server.

The “LastChk” column shows a value like L7OK/200 in Xms. That value means that a Layer 7 health check was performed; it returned an HTTP 200 OK response and it did so within X millisecond.

The “Wght” column shows the proportion of traffic it will accept, as set by the weight parameter on the server line. The “Act” column shows if the server is active (marked with a Y) or a backup (marked with a -). The “Bck” column shows if the server is a backup (marked with a Y) or active (marked with a -).

The “Chk” column shows the number of failed health checks. The “Dwn” column shows the number of transitions from UP to DOWN. The “Dwntme” column shows how long the server has been down.

If you’ve added a slowstart parameter to a server line, then when you disable and later enable that server, the “Thrtle” column shows the percentage of traffic the server will accept. The percentage will gradually rise to 100% over the period you’ve set.

This information is based on a HAProxy blog post that you can refer for more detailed information.

HAProxy on ClusterControl

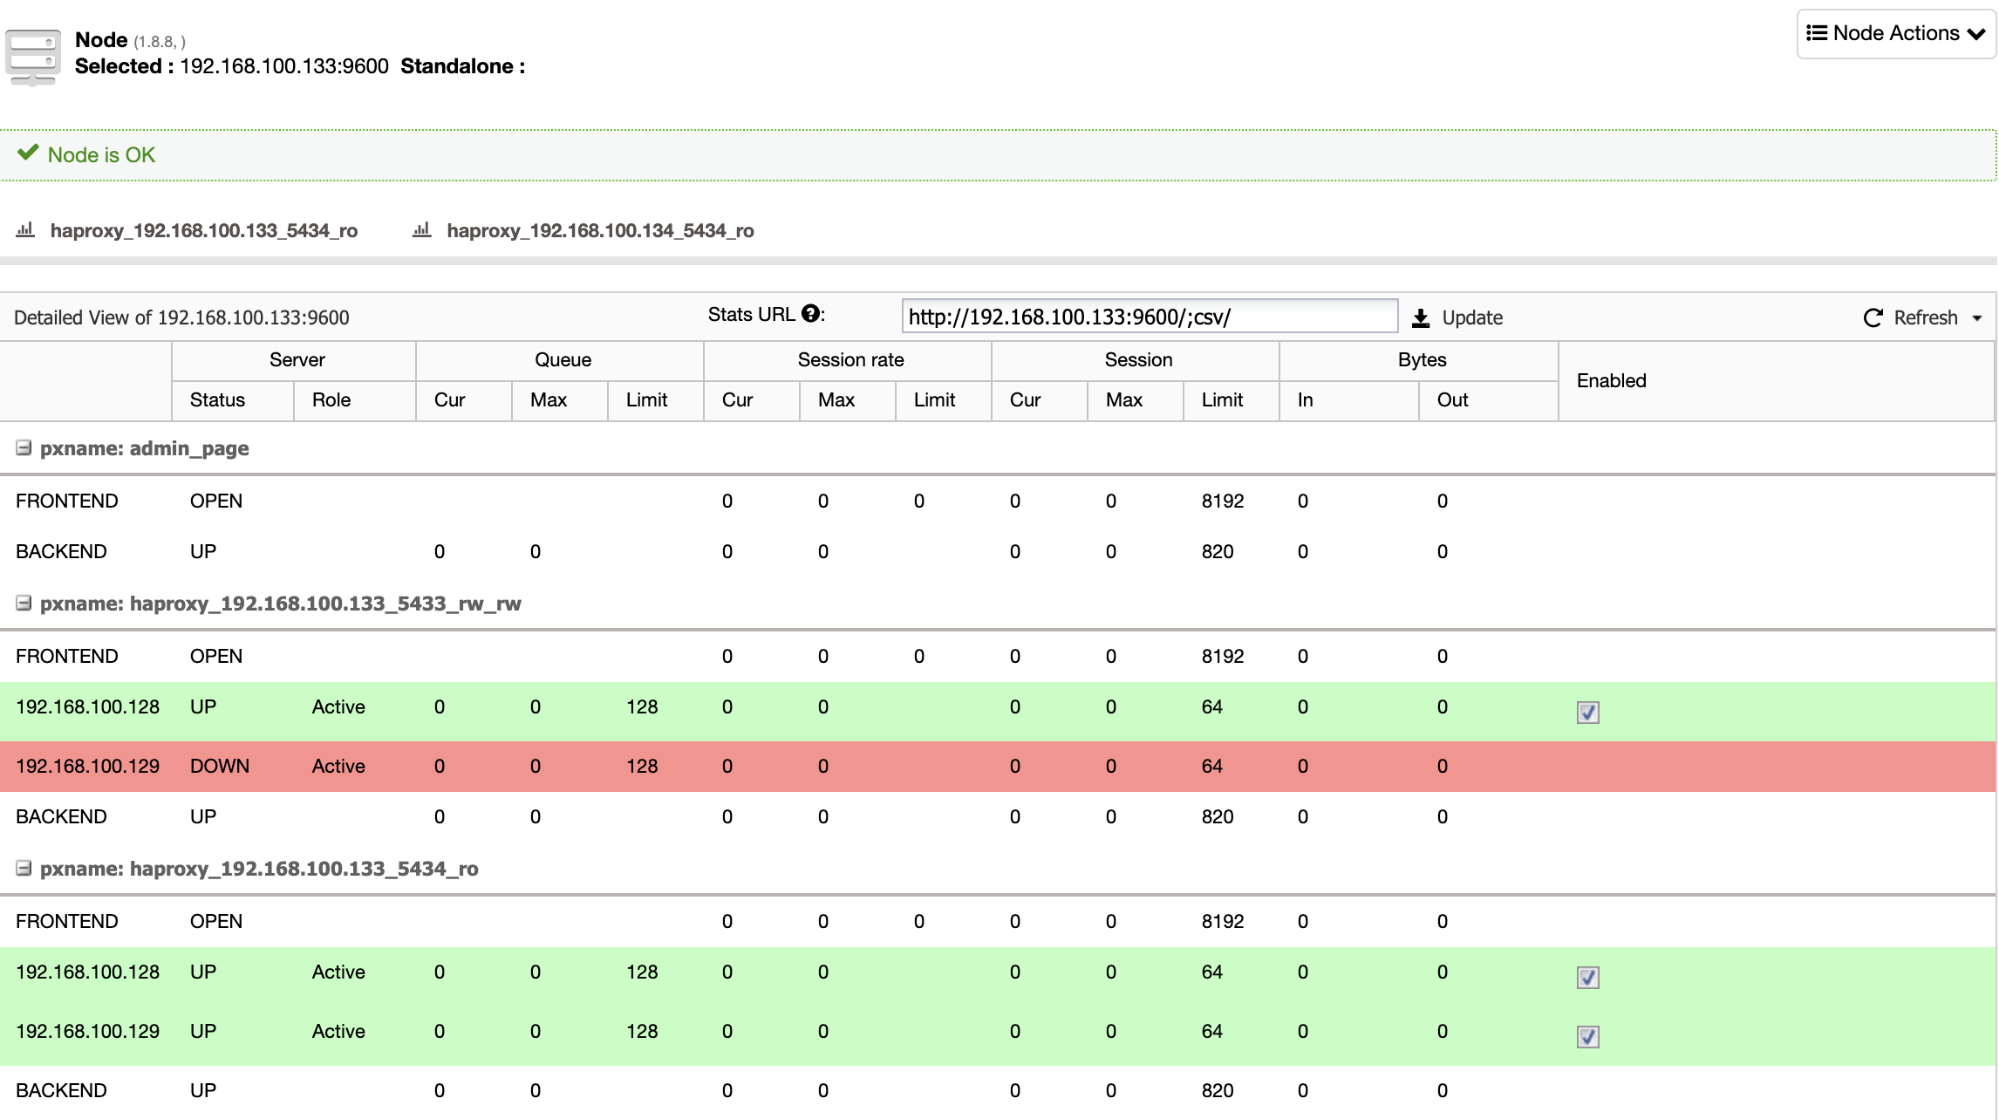
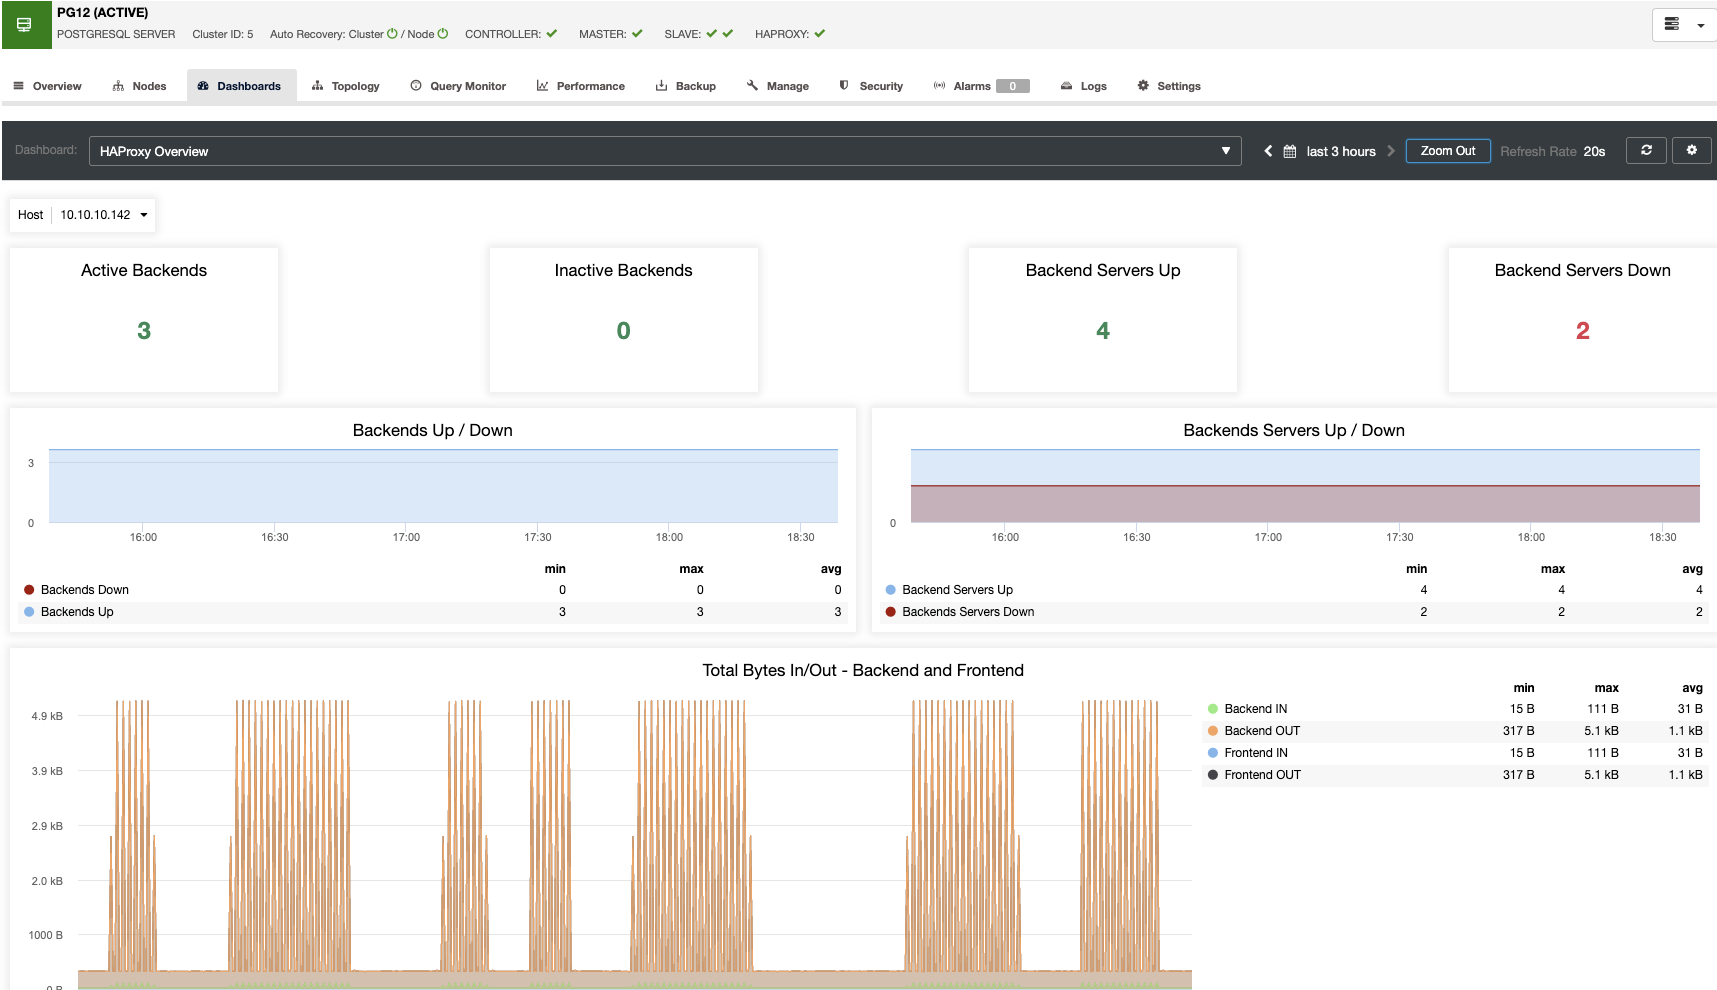
Other than deployment and management, ClusterControl also provides insight into HAProxy statistics and Real-Time Dashboards from the UI. From ClusterControl, you can access the statistics page at ClusterControl -> Select Cluster -> Nodes -> choose the HAProxy node similar to screenshot below:

You can enable/disable a server from the load balancing by ticking/unticking the checkbox button under “Enabled” column. This is very useful when you want your application to intentionally skip connecting to a server e.g., for maintenance or for testing and validating new configuration parameters or optimized queries.

You can also monitor your HAProxy servers from ClusterControl by checking the Dashboard section.

To enable it, you just need to go to ClusterControl -> Select Cluster -> Dashboards -> Enable Agent Based Monitoring. This will deploy an agent on each node to get all the information to generate the corresponding graphs.

Here, you won’t only see all the necessary metrics to monitor the HAProxy node, but also to monitor all the environment using the different Dashboards.

Conclusion

HAProxy is a good and powerful tool to improve your database and application performance. It is also useful to add High Availability and Failover to your environment. To know what is happening in your HAProxy node, you need to understand the metrics that are being monitored in the stats page, or even improve this monitoring by adding a dashboard to make it more friendly.

In this blog, we have explained each metric mentioned in the HAProxy stats page, and we also showed how it looks on ClusterControl, where you can access both statistics and dashboards HAProxy sections from the same system.

Tips for Upgrading to from MySQL 5.7 to MySQL 8

$
0
0

MySQL 8.0 has been with us already for quite some time and many MySQL users have already upgraded to this version. For those who are still using older MySQL versions, we would like to present this blog where we will share some tips and information that help in the upgrade process for MySQL 8.0.

Mind Your Version

Software versions are quite important in the upgrade process. For starters, only one major version difference is supported. You have to be running MySQL 5.7 before you can upgrade to MySQL 8.0. This is quite important to keep in mind given that MySQL 5.6 is approaching its End-of-Life and it won’t be supported anymore. For all of you who use MySQL 5.6 you have to make sure you upgrade it to MySQL 5.7 first and then, eventually, to MySQL 8.0.

What’s strongly recommended is that you upgrade to the latest version available for MySQL 5.7. At the time of writing this blog it was 5.7.31 but this will eventually change, you can always look it up at MySQL website.

Please also note that upgrades from non-GA (and to non-GA) versions are not supported. Not that it makes any sense to run non-GA versions in production but we wanted to make this one clear as well.

It’s a One Way Ticket

Whenever you decide to perform the upgrade, please be aware that, once the upgrade is complete, there is no coming back. The changes are not compatible and you just simply cannot use the data directory from MySQL 8.0 on MySQL 5.7. Make sure that you take a backup of your MySQL 5.7 data directly before the upgrade - you would be able to restore it on MySQL 5.7 instance should you need to revert the change. Please also keep in mind, as it may come as a surprise, that upgrade from MySQL 8.0.x to MySQL 8.0.x+1 may also be not compatible and, even though it is a minor version upgrade, you should not expect that downgrade would be possible. This is the result of Oracle’s deployment cycle - instead of doing feature-freeze for the latest GA branch, as it was the case with previous versions, new features, sometimes incompatible ones, are pushed as new releases of 8.0 branch.

In-Place Upgrade is a Go

In the past it was not always possible to perform an in-place upgrade of MySQL. In some cases you were forced to dump the data into SQL format and then load it back up to the new version. Luckily, MySQL 8.0 is more admin-friendly and in-place upgrade is supported. All you need to do is to run apt upgrade or yum update and you are all set. The upgrade is even more convenient - in the past one had to keep in mind to run mysql_upgrade to ensure all system tables are properly upgraded to the format required by the new version of MySQL. In MySQL 8.0, starting from MySQL 8.0.16, this is no longer needed - all you have to do is to start MySQL process, mysqld, and, by default, the upgrade will be performed over the data dictionary and other system schemas whenever it’s determined to be required. It is possible to change this behavior by passing different parameters to--upgrade server option but in the majority of the cases you would like to benefit from this improvement.

Am I Safe to Upgrade?

Of course, there are prerequisites for the safe upgrade. Let’s take a look at some methods that should help you to ensure you can safely upgrade to MySQL 8.0.

Sanity Checks

Before you attempt anything, you should double-check that your existing MySQL 5.7 setup ticks all the boxes on the sanity checklist before upgrading to MySQL 8.0. MySQL documentation presents an extensive list of things to test. It doesn’t make sense to go over the list here as it’s covered in the MySQL documentation, but here are a couple of points you may want to keep in mind.

First, partitioning is now supported only in engines that implement it on their end, which are NDB and InnoDB only. Please make sure that all the partitioned tables use one of those storage engines or that you remove the partitioning before the upgrade.

You May Want to Run

mysqlcheck -u root -p --all-databases --check-upgrade

to double-check that tables are in the proper format.

There are also other checks that you should perform - almost every new MySQL version comes with an updated list of reserved words and you should check that you don’t use them in your database. You need to check foreign key constraint names, they cannot be longer than 64 characters. Some options for sql_mode have been removed thus you should make sure you do not use them. As we mentioned, there’s an extensive list of things to test.

MySQL Shell to the Rescue

Testing all of those conditions is quite time-consuming therefore Oracle created an option in the MySQL Shell that is intended to run a series of tests to verify if your existing installation is safe to upgrade to MySQL 8.0. For starters, if you do not have MySQL Shell installed, you should do that. You can find downloads on Oracle’s website. Once you set it up, you can connect to your MySQL 5.7 and run the test. Let’s see how it can look like:

root@vagrant:~# mysqlsh

MySQL Shell 8.0.21


Copyright (c) 2016, 2020, Oracle and/or its affiliates. All rights reserved.

Oracle is a registered trademark of Oracle Corporation and/or its affiliates.

Other names may be trademarks of their respective owners.


Type '\help' or '\?' for help; '\quit' to exit.

 MySQL  JS > \c root@localhost

Creating a session to 'root@localhost'

Please provide the password for 'root@localhost': ****

Save password for 'root@localhost'? [Y]es/[N]o/Ne[v]er (default No):

Fetching schema names for autocompletion... Press ^C to stop.

Your MySQL connection id is 71 (X protocol)

Server version: 5.7.31-log MySQL Community Server (GPL)

No default schema selected; type \use <schema> to set one.

We connected to the MySQL instance on the localhost using MySQL Shell. Now we can run the check. We’ll pass the path to the configuration file for more extensive tests:

MySQL  localhost:33060+ ssl  JS > util.checkForServerUpgrade({"configPath":"/etc/mysql/my.cnf"})

Then we have a long output.

The MySQL server at localhost:33060, version 5.7.31-log - MySQL Community

Server (GPL), will now be checked for compatibility issues for upgrade to MySQL

8.0.21...


1) Usage of old temporal type

  No issues found


2) Usage of db objects with names conflicting with new reserved keywords

  No issues found


3) Usage of utf8mb3 charset

  No issues found


4) Table names in the mysql schema conflicting with new tables in 8.0

  No issues found


5) Partitioned tables using engines with non native partitioning

  No issues found


6) Foreign key constraint names longer than 64 characters

  No issues found


7) Usage of obsolete MAXDB sql_mode flag

  No issues found


8) Usage of obsolete sql_mode flags

  No issues found


9) ENUM/SET column definitions containing elements longer than 255 characters

  No issues found


10) Usage of partitioned tables in shared tablespaces

  No issues found


11) Circular directory references in tablespace data file paths

  No issues found


12) Usage of removed functions

  No issues found


13) Usage of removed GROUP BY ASC/DESC syntax

  No issues found


14) Removed system variables for error logging to the system log configuration

  No issues found


15) Removed system variables

  Error: Following system variables that were detected as being used will be

    removed. Please update your system to not rely on them before the upgrade.

  More information:

    https://dev.mysql.com/doc/refman/8.0/en/added-deprecated-removed.html#optvars-removed


  log_warnings - is set and will be removed, consider using log_error_verbosity

    instead

  query_cache_size - is set and will be removed

  query_cache_type - is set and will be removed


16) System variables with new default values

  Warning: Following system variables that are not defined in your

    configuration file will have new default values. Please review if you rely on

    their current values and if so define them before performing upgrade.

  More information:

    https://mysqlserverteam.com/new-defaults-in-mysql-8-0/


  back_log - default value will change

  character_set_server - default value will change from latin1 to utf8mb4

  collation_server - default value will change from latin1_swedish_ci to

    utf8mb4_0900_ai_ci

  event_scheduler - default value will change from OFF to ON

  explicit_defaults_for_timestamp - default value will change from OFF to ON

  innodb_flush_neighbors - default value will change from 1 (enable) to 0

    (disable)

  innodb_max_dirty_pages_pct - default value will change from 75 (%)  90 (%)

  innodb_max_dirty_pages_pct_lwm - default value will change from_0 (%) to 10

    (%)

  innodb_undo_log_truncate - default value will change from OFF to ON

  innodb_undo_tablespaces - default value will change from 0 to 2

  log_error_verbosity - default value will change from 3 (Notes) to 2 (Warning)

  max_error_count - default value will change from 64 to 1024

  optimizer_trace_max_mem_size - default value will change from 16KB to 1MB

  performance_schema_consumer_events_transactions_current - default value will

    change from OFF to ON

  performance_schema_consumer_events_transactions_history - default value will

    change from OFF to ON

  slave_rows_search_algorithms - default value will change from 'INDEX_SCAN,

    TABLE_SCAN' to 'INDEX_SCAN, HASH_SCAN'

  transaction_write_set_extraction - default value will change from OFF to

    XXHASH64


17) Zero Date, Datetime, and Timestamp values

  No issues found


18) Schema inconsistencies resulting from file removal or corruption

  No issues found


19) Tables recognized by InnoDB that belong to a different engine

  No issues found


20) Issues reported by 'check table x for upgrade' command

  No issues found


21) New default authentication plugin considerations

  Warning: The new default authentication plugin 'caching_sha2_password' offers

    more secure password hashing than previously used 'mysql_native_password'

    (and consequent improved client connection authentication). However, it also

    has compatibility implications that may affect existing MySQL installations.

    If your MySQL installation must serve pre-8.0 clients and you encounter

    compatibility issues after upgrading, the simplest way to address those

    issues is to reconfigure the server to revert to the previous default

    authentication plugin (mysql_native_password). For example, use these lines

    in the server option file:


    [mysqld]

    default_authentication_plugin=mysql_native_password


    However, the setting should be viewed as temporary, not as a long term or

    permanent solution, because it causes new accounts created with the setting

    in effect to forego the improved authentication security.

    If you are using replication please take time to understand how the

    authentication plugin changes may impact you.

  More information:

    https://dev.mysql.com/doc/refman/8.0/en/upgrading-from-previous-series.html#upgrade-caching-sha2-password-compatibility-issues

    https://dev.mysql.com/doc/refman/8.0/en/upgrading-from-previous-series.html#upgrade-caching-sha2-password-replication


Errors:   3

Warnings: 18

Notices:  0


3 errors were found. Please correct these issues before upgrading to avoid compatibility issues.

As you can see, 21 tests in total have been performed, the check has found 3 errors related to the configuration options that will not exist in MySQL 8.0.21. The tests are quite detailed. Among other things you will learn about changes in the default values for variables that you do not have configured in your MySQL configuration (so, those settings will change once you install MySQL 8.0).

Rolling Back a Failed Upgrade

As we mentioned before, you cannot downgrade from MySQL 8.0 once upgrade is complete. Luckily, it doesn’t mean you cannot rollback the upgrade if it fails in the middle. Actually, it happens semi-automatically should one of the issues we discussed in the previous section is detected. The only manual action that is required would be to remove redo logs and start MySQL 5.7 to address the problems detected during the upgrade. Then you should perform a slow shutdown (innodb_fast_shutdown=0) to ensure everything is written to the tablespaces and then you are all good to attempt the upgrade once more.

Final Tips

There are two, quite important changes in the default behavior that comes with MySQL 8.0 we would like to highlight.

Caching_sha2_password as the default

Please make sure that you double-check if your applications and proxies will work properly with caching_sha2_password authentication plugin as it becomes the default one in MySQL 8.0. Older applications might be impacted and not able to connect to the database. Of course, you can change this to whatever authentication plugin you want (like mysql_native_password for example, as it was the default in previous MySQL versions) so it is not a blocker by any means. It’s just something to remember to test before the upgrade so you won’t end up with MySQL 8.0 and apps that cannot connect to it unless you reconfigure your database to use an older authentication mechanism.

UTF8mb4 as the default charset

This shouldn’t come as a surprise given how widely changed to UTF8 was discussed in the community, but that’s the fact - MySQL 8.0 comes with UTF8mb4 charset as the default one. This has some additional impact that you should be aware of. First, your dataset’s size might increase if you will use UTF8mb4 charset. This leads to memory buffers being able to store smaller amounts of data than for data with latin1 charset. Second, the performance of MySQL is expected to be reduced. Sure, Oracle did a great job of minimizing the impact of this change, but you cannot expect that there will be no performance impact whatsoever - it will be some.

We hope this blog post will help you to go through the process of upgrading from MySQL 5.7 to MySQL 8.0. If you have your thoughts on the process, we encourage you to share them in the comments below this post.

How to Perform an Online Upgrade of Percona XtraDB Cluster to Percona XtraDB Cluster 8.0

$
0
0

Percona XtraDB Cluster based on MySQL 8.0 has been out there for some time, so it’s not surprising more and more people are attempting to migrate into it. You may wonder how to approach this process - in this short blog post we would like to give you some suggestions on how to handle the upgrade of Galera Cluster based on MySQL 5.7 to Galera Cluster based on MySQL 8.0.

First things first, you may have noticed we are talking about specific versions of Percona XtraDB Cluster - 5.7 into 8.0. This is because Galera, on which PXC is based, is an addition to MySQL and as such it has to follow all the guidelines for MySQL upgrade. Those guidelines are clear - the only supported upgrade to MySQL 8.0 is from MySQL 5.7. As the first step you have to ensure that there are no roadblocks on the MySQL side. You can refer to our previous blog post, in which we shared some tips related to upgrading MySQL from 5.7 to 8.0. Make yourself familiar with the differences between those versions, verify that neither of the incompatible changes really impact your application. Once this is confirmed, ideally through tests, we can start planning the upgrade of PXC. There are two major ways of performing the online upgrade for Galera Cluster, let’s take a look at them now.

In-Place Upgrade

While not recommended, with some it is possible to have both PXC 5.7 and PXC 8.0 nodes running in the same cluster, this allows us to perform an in-place upgrade in which we will upgrade nodes in the cluster one by one, resulting in a cluster running on PXC 8.0. There are a couple of gotchas you have to keep in mind while doing so. For starters, as we said, you have to tick all the boxes on the MySQL 8.0 upgrade checklist. Then there are a couple of steps you have to take.

First, download the percona-release package:

wget https://repo.percona.com/apt/percona-release_latest.generic_all.deb

and install it:

dpkg -i percona-release_latest.generic_all.deb

Then, enable Percona XtraDB Cluster 8.0 in the repositories: 

percona-release enable pxc-80 release

Finally, update apt and install percona-xtradb-cluster package:

apt update

apt install percona-xtradb-cluster

While installing, you will be presented with two dialog boxes.

In the first one you can decide if you want to enable caching_sha2_password or you want to use the old mechanism for hashing passwords. For the compatibility sake we decided to use the old one for now - this is something you can always change at the later time.

The next dialog asks if we want to use existing my.cnf or replace it. Please keep in mind that in PXC 8.0 the structure of the configuration files in /etc/ directory has changed. We would probably want to keep the old my.cnf as it contains working configuration for our cluster, some tuned settings etc, but eventually this would have to be reviewed and migrated into new configuration file structure.

After PXC 8.0 is installed, before you start it, there are a couple of settings you want to check in your my.cnf. Those are changes from standard my.cnf generated by ClusterControl, your mileage may vary therefore look out for the error log in case you won’t be able to start PXC 8.0.

For starters, this will be a mixed cluster for a while therefore we have to disable cluster traffic encryption added in PXC 8.0:

pxc-encrypt-cluster-traffic=OFF

Then we had to disable following settings that were incompatible with PXC (or MySQL) 8.0:

#log_warnings=2

#ignore-db-dir=lost+found

#ignore-db-dir=.s9s_do_not_delete

#query_cache_type = 0

#query_cache_size = 0

#wsrep_convert_LOCK_to_trx=0

#wsrep_drupal_282555_workaround=0

#wsrep_causal_reads=0

#wsrep_sst_auth=user:pass

Please also make sure that you have set:

read_only=OFF

super_read_only=OFF

This may not be the case if the cluster you are upgrading has been created through the “Create Slave Cluster” job in ClusterControl.

That’s pretty much all - start PXC:

systemctl start mysql

It should finish just fine. In case you run into any sorts of troubles, try to force SST - remove the data directory on the node that you upgrade and start the mysqld process again. Please keep in mind that SST from PXC 5.7 to PXC 8.0 works just fine.

The Slave Cluster Approach

With more free nodes available, you can approach the upgrade differently: two clusters on different major versions running in parallel and connected through asynchronous replication. The main advantage of this approach is that it will let you test the PXC 8.0 more thoroughly as you will have it up and running for a while (basically for as long as you need it) and you can test your application on this cluster. At any point in time you can move some of the read-only workload to the PXC 8.0 seeing how queries perform, looking for possible errors or performance problems. If you use ClusterControl, this can be accomplished by using the “Create Slave Cluster” job.

You will be asked to decide where the initial data should come from, master PXC node or from the backup.

You will also need to pass the connectivity details like SSH user and key path.

Then you will be asked to pick the vendor and version - you probably want to use PXC 5.7 for now, you will upgrade the nodes later, testing the upgrade process itself.

Finally, you have to pass the node hostnames or IP addresses for ClusterControl to connect to and start setting the nodes up.

As the result you will have a second Percona XtraDB Cluster running in version 5.7, replicating from the original cluster. That cluster can be upgraded to the new version, as we discussed in the “In-place upgrade” section and, eventually, you can switch your traffic towards it and deprecate the old cluster.

In case of any problems with the replication link, you should be able to recreate it easily with CHANGE MASTER TO … command, executed using the credentials used for the initial setup (if this has been done from ClusterControl, you’ll see them in /etc/cmon.d/cmon_X.cnf as repl_user and repl_password, where X is the cluster ID of the master cluster).

We hope this short blog post will help you to go through the process of upgrading Percona XtraDB Cluster from version 5.7 to version 8.0.

How to Perform Rolling Upgrades for MySQL

$
0
0

There are different reasons for upgrading your databases. It could be to apply security fixes, to use new features, solve compatibility issues, or just to keep your system up-to-date. This upgrade can be a major upgrade or a minor one, and depending on the technology, there are different approaches to do this job, but if you need your systems running all the time with zero downtime, performing a rolling upgrade could be the best option.

In this blog, we will see some considerations to take into account before upgrading and how to perform a rolling upgrade on MySQL.

Minor vs Major Upgrades

In general, minor upgrades are safe in the way that you can easily downgrade or rollback it and should be compatible with the previous packages and features.

Major version upgrade involves some risks like database package removal, configuration and connectors compatibility, deprecated features, and more.

So, even when testing is important for both scenarios, in case of major upgrades, it is a must if you want to avoid serious problems for your business.

Before Upgrading

Now, let’s see some considerations before upgrading, to avoid future issues.

Backups

Backups are always important, and even more if you want to upgrade your database. If something goes wrong, and other disaster recovery options fail, you will need a backup to restore your database. So, before starting the task, take a full backup (physical or/and logical) of your current database and keep it safe until make sure everything is working properly for a couple of days/weeks.

Review Deprecated Features

If you are using a feature that is deprecated in the new version, your application could fail, and you will need to rollback to recover your systems, which will generate downtime (depends on the approach) and a loss of time. Checking the deprecated feature and comparing them to the ones that you are using will avoid this failed upgrade attempt.

Testing

This is important not only for upgrades but also for any change in your database or application. Having a test environment that replicates the production environment could save your time and avoid unexpected issues during any upgrade or database change.

Rollback

In any upgrade, it is important to have a rollback ready to be used if needed to have your database up and running ASAP. Otherwise, it could affect your RTO (Recovery Time Objective) in case you need to recreate the cluster from a backup or another recovery plan option.

Keep in mind that sometimes downgrades are not possible, so you should have a secondary plan in case you need to rollback your changes.

Vendor Checks

Depending on the vendor and version, you may use the mysqlcheck command to perform the preliminary check on your current installation and confirm that you are ready to go.

$ mysqlcheck -u root -p --all-databases --check-upgrade

Enter password:

mysql.columns_priv                                 OK

mysql.db                                           OK

mysql.engine_cost                                  OK

mysql.event                                        OK

mysql.func                                         OK

mysql.general_log                                  OK

mysql.gtid_executed                                OK

mysql.help_category                                OK

mysql.help_keyword                                 OK

mysql.help_relation                                OK

mysql.help_topic                                   OK

mysql.innodb_index_stats                           OK

mysql.innodb_table_stats                           OK

mysql.ndb_binlog_index                             OK

mysql.plugin                                       OK

mysql.proc                                         OK

mysql.procs_priv                                   OK

mysql.proxies_priv                                 OK

mysql.server_cost                                  OK

mysql.servers                                      OK

mysql.slave_master_info                            OK

mysql.slave_relay_log_info                         OK

mysql.slave_worker_info                            OK

mysql.slow_log                                     OK

mysql.tables_priv                                  OK

mysql.time_zone                                    OK

mysql.time_zone_leap_second                        OK

mysql.time_zone_name                               OK

mysql.time_zone_transition                         OK

mysql.time_zone_transition_type                    OK

mysql.user                                         OK

sys.sys_config                                     OK

This is a first check to perform before upgrading, and it will check that there is not:

  • Tables using obsolete data types or functions
  • Orphan frm files
  • Triggers with missing or empty definer or an invalid creation context

There are a few more things you need to check but to avoid an extensive blog post, you can refer to the official MySQL documentation for this.

Manual Rolling Upgrades for MySQL

There are different approaches to perform a rolling upgrade. It could be in place, using replication, or even a mix of them. In any case, if you want to avoid downtime you shouldn’t perform changes in your application during the upgrade. For this, you can add a Load Balancer in front of your databases. Your application will connect to your Load Balancer, and it will redirect the traffic to the available nodes.

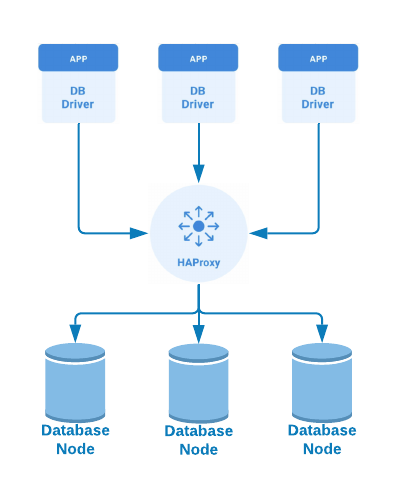
Let’s say you have a MySQL Replication with 1 master and 2 slave nodes, and 1 HAProxy node in front of them:

A simplified way to perform a manual rolling upgrade on this environment could be:

  • Disable one slave node from your HAProxy
  • Make sure you don’t have traffic on this slave node
  • Upgrade the slave node manually
  • Check the replication status to make sure is up-to-date
  • Disable the master node in your HAProxy
  • Make sure you don’t have traffic on your master node
  • Promote the upgraded slave node
  • Enable it in your HAProxy
  • Confirm that the new master is receiving traffic
  • Reconfigure your second slave to replicate from the new master
  • Disable the second slave from your HAProxy
  • Make sure you don’t have traffic on this slave node
  • Upgrade the slave node manually
  • Check the replication status to make sure is up-to-date
  • Enable it in your HAProxy
  • Confirm that the slave node is receiving traffic (if needed)
  • Reconfigure your old master to replicate from the new master
  • Upgrade the old master node manually
  • Check the replication status to make sure is up-to-date
  • Enable it in your HAProxy
  • Confirm that the old master (now slave) is receiving traffic (if needed)

As you can see, even in a simplified way, this task requires many steps, and it means more possibilities of something going wrong.

ClusterControl Rolling Upgrades for MySQL

The best way to reduce the possibility of failure is by automating all (or almost all) these steps. Using ClusterControl you can perform a minor rolling upgrade of your MySQL cluster with just a few clicks.

To do this, go to ClusterControl -> Select Cluster -> Manage -> Upgrades, where you see the Upgrade option.

Upgrades are online and are performed on one node at a time. The node will be stopped, the software will be updated, and then the node will be started again. If a node fails to upgrade, the process is aborted.

If you choose the Upgrade option, you will see a confirmation about the version that will be upgraded:

And you just need to press on Upgrade to confirm this job. After this, you can monitor the upgrade process in the ClusterControl Activity Section:

At the same time, ClusterControl will reconfigure your Load Balancers to send the traffic to the available nodes.

ClusterControl only supports minor upgrades, because, as we mentioned before, a major upgrade is a risky task that requires testing and research to make sure that your application will work fine on the new major version.

Conclusion

Upgrading is an important task in all companies and it could be risky if you don’t take certain precautions and follow all the upgrade steps correctly.

In this blog, we mentioned some considerations to take into account before upgrading your database, and we showed the difference between doing this task manually and using ClusterControl, which helps you to minimize the possibility of failure.

Tips for Upgrading Percona XtraDB Cluster to 8.0

$
0
0

MySQL 8.0 has been available for a while and Percona XtraDB Cluster 8.0 has also been available for some time as well. Also, MySQL 5.6 is coming up to its End-of-Life and people using PXC 5.6 will also want to migrate to a more recent version soon. Let’s take a look at the process and share some tips around it.

Remember, it is MySQL Underneath...

For starters, you have to keep in mind that Galera is just a plugin that works with MySQL so you have to ensure that you adhere to the migration rules and processes for your particular MySQL version that’s used in your PXC. If we are running PXC 5.7 and you want to upgrade to PXC 8.0, you need to first check all the boxes on the MySQL upgrade checklist. We covered some of that in our blog describing the upgrade process between MySQL 5.7 and MySQL 8.0. It also means that only upgrade paths supported by MySQL are viable - for example, you cannot upgrade PXC 5.6 directly to PXC 8.0 as direct MySQL upgrade from 5.6 to 8.0 is not supported.

Read the Upgrade Documentation

As usual, whenever you plan an upgrade, you should familiarize yourself with the documentation prepared by the vendor. Percona has a web page dedicated to explaining the upgrade process and caveats around it. We’ll go over some of those points in this blog post.

Configuration Changes

There are a couple of changes in the default configuration settings that may trigger issues in the upgrade process - pxc_strict_mode is set to ENFORCING by default. This mode blocks any kind of configuration that is experimental and may affect the stability of the cluster. Checks cover, among other things, used storage engines, binary log format, existence of primary keys and some other things. When upgrading, you may want to set it to PERMISSIVE to track the incompatibilities in the error log but otherwise let the PXC run even if some things are not in the best shape.

Another setting, pxc_encrypt_cluster_traffic, is also enabled by default, enforcing encryption of the Galera communication between nodes. It is not possible to mix nodes with encrypted and unencrypted nodes in the same cluster therefore you either have to set it up on all of the nodes or ensure you disable the pxc_encrypt_cluster_traffic on the new, PXC 8.0 nodes.

Change in the Default Authentication Plugin

We mentioned this in our blog post on migration to MySQL 8.0, but the change is so important that we want to reiterate it here as well - with MySQL 8.0 the default authentication plugin changes to caching_sha2_password - this may make some of the older applications incompatible with MySQL 8.0. Of course, you can change this setting but if you do not take it under consideration, it may backfire after the upgrade is complete.

Upgrade Processes

For starters, please keep in mind that, while not recommended, with some it is possible to have both PXC 5.7 and PXC 8.0 nodes running in the same cluster. This opens an opportunity to do an in-place, live upgrade. The process would be quite simple - stop PXC 5.7 node, upgrade it to PXC 8.0 by installing a new version and starting it. In the process data directory will be upgraded to the new version and the new PXC 8.0 node should be able to start properly and join the cluster. Then you proceed with the nodes one by one, migrating them from PXC 5.7 to PXC 8.0. Please keep in mind that you should avoid SST as a data directory from PXC 8.0 node cannot be used on 5.7. The other way around should work ok. To prevent SST from happening, ensure that the gcache size is large enough to accommodate writes and allow IST to happen. IST itself will work just fine.

If you have more free nodes, you can always perform the upgrade with two clusters on different major versions running in parallel and connected through asynchronous replication. What is important, such approach will let you test the PXC 8.0 more thoroughly as you will have it up and running for a while (basically for as long as you need it) and you can test your application on this cluster - at any point in time you can move some of the read-only workload to the PXC 8.0 seeing how queries are handled, if there are any errors or performance issues. 

If you use ClusterControl, this can be accomplished by using the “Create Slave Cluster” job.

You will be asked to decide where the initial data should come from, master PXC node or from the backup.

You will also need to pass the connectivity details like SSH user and key path.

Then you will be asked to pick the vendor and version - you probably want to use PXC 5.7 for now, you will upgrade the nodes later, testing the upgrade process itself.

Finally, you have to pass the node hostnames or IP addresses for ClusterControl to connect to and start setting the nodes up.

As the result you will have a second Percona XtraDB Cluster running in version 5.7, replicating from the original cluster. That cluster can be upgraded to the new version and, eventually, you can switch your traffic towards it. We have explained this process in detail in our previous blog post.

We hope that this short blog post will help you to prepare better to upgrade your Percona XtraDB Cluster to version 8.0.

Live Migrations Using MySQL Replication

$
0
0

Migrating your database to a new datacenter can be a high-risk and time-consuming process. A database contains state, and can be much harder to migrate as compared to web servers, queues or cache servers.

In this blog post, we will give you some tips on how to migrate your data from one service provider to another. The process is somewhat similar to our previous post on how to upgrade MySQL, but there are a couple of important differences.

MySQL Replication or Galera Cluster?

Switching to another service provider (e.g., moving from AWS to Rackspace or from colocated servers to cloud) very often means one would build a brand new infrastructure in parallel, sync it with the old infrastructure and then switch over to it. To connect and sync them, you may want to leverage MySQL replication.

If you are using Galera Cluster, it might be easier to move your Galera nodes to a different datacenter. However, note that the whole cluster still has to be treated as a single database. This means that your production site might suffer from the additional latency introduced when stretching Galera Cluster over the WAN. It is possible to minimize impact by tuning network settings in both Galera and the operating system, but the impact cannot be entirely eliminated. It is also possible to set up asynchronous MySQL Replication between the old and the new cluster instead, if the latency impact is not acceptable.

Setting Up Secure Connectivity

MySQL Replication is unencrypted, and therefore not safe to use over the WAN. There are numerous ways of ensuring that your data will be transferred safely. You should investigate if it is possible to establish a VPN connection between your current infrastructure and your new service provider. Most of the providers (for example both Rackspace and AWS) provids such a service - you can connect your “cloudy” part to your existing datacenter via virtual private network.

If, for some reason, this solution does not work for you (maybe it requires hardware that you do not have access to), you can use software to build a VPN - one of them will be OpenVPN. This tool will work nicely to setup encrypted connections between your datacenters.

If OpenVPN is not an option, there are more ways to ensure replication will be encrypted. For example, you can use SSH to create a tunnel between old and new datacenters, and forward the 3306 port from the current MySQL slave (or master) to the new node. It can be done in a very simple way as long as you have SSH connectivity between the hosts:

$ ssh -L local_port:old_dc_host:mysql_port_in_old_dc root@old_dc_host -N &

For example:

$ ssh -L 3307:10.0.0.201:3306 root@10.0.0.201 -N &

Now, you can connect to the remote server by using 127.0.0.1:3307

$ mysql -P3307 -h 127.0.0.1

It will work similarly for the replication, just remember to use 127.0.0.1 for the master_host and 3307 for the master_port

Last but not least you can encrypt your replication using SSL. This previous blog post explains how it can be done and what kind of impact it may have on the replication performance.

If you decided to use Galera replication across both datacenters, the above suggestions also apply here. When it comes to the SSL, we previously blogged about how to encrypt Galera replication traffic. For a more complete solution, you may want to encrypt all database connections from client applications and any management/monitoring infrastructure.

Setting Up the New Infrastructure

Once you have connectivity, you need to start building the new infrastructure. For that, you will probably use xtrabackup or mariabackup. It might be tempting to combine the migration with the MySQL upgrade, after all you are setting up whole new environment in the new location. We would not recommend to do that. Migrating to a new infrastructure is significant enough on it’s own so combining it with another major change increases complexity and risk. That’s true for other things too - you want to take step-by-step approach to changes. Only by changing things one at a time that you can understand the results of the changes, and how they impact your workload - if you made more than one change at a given time, you cannot be sure which one is responsible for a given (new) behavior that you’ve observed.

When you have a new MySQL instance up and running in the new datacenter, you need to slave it off the node in the old datacenter - to ensure that data in both datacenters will stay in sync. This will become handy as you prepare yourself for the final cutover. It’s also a nice way of ensuring that the new environment can handle your write load.

Next step will be to build a complete staging infrastructure in the new location and perform tests and benchmarks. This is a very important step that shouldn’t be skipped - the problem here is that you, as the DBA, have to understand the capacity of your infrastructure. When you change the provider, things also change. New hardware/vm’s are faster or slower. There’s more or less memory per instance. You need to understand again how your workload will fit in the hardware you are going to use. For that you’ll probably use Percona Playback or pt-log-player to replay some of the real life queries on the staging system. You’ll want to test the performance and ensure that it’s on a level which is acceptable for you. You also want to perform all of the standard acceptance tests that you run on your new releases - just to confirm that everything is up and running. In general, all applications should be built in a way that they do not rely on the hardware configuration and on a current setup. But something might have slipped through and your app may depend on some of the config tweaks or hardware solutions that you do not have in the new environment.

Finally, once you are happy with your tests, you’ll want to build a production-ready infrastructure. After this is done, you may want to run some read-only tests for final verification. This would be the final step before the cutover.

Cutover

After all those tests have been performed and after the infrastructure was deemed production-ready, the last step is to cutover traffic from the old infrastructure.

Globally speaking, this is a complex process but when we are looking at the database tier, it’s more or less the same thing as standard failover - something that you may have done multiple times in the past. We covered it in details in an earlier post, in short the steps are: stop the traffic, ensure it’s stopped, wait while the application is being moved to the new datacenter (DNS records change or what not), do some smoke tests to ensure all looks good, go live, monitor closely for a while.

This cutover will require some downtime, as we can see. The problem is to make sure we have consistent state across the old site and the new one. If we want to do it without downtime, then we would need to set up master-master replication. The reason is that as we refresh DNS and move over sessions from the old site to the new one, both systems will be in use at the same time - until all sessions are redirected to the new site. In the meantime, any changes on the new site need to be reflected on the old site. 

Using Galera Cluster, as described in this blog post, can also be a way to keep data between the two sites in sync.

We are aware this is a very brief description of the data migration process. Hopefully, it will be enough to point you into a good direction and help you identify what additional information you need to look for.

Top Open Source Tools for MySQL & MariaDB Migrations

$
0
0

Large organizations that are using MySQL or MariaDB database platforms are often faced with a need to perform a database migration from one place to another. Regardless of the platform, type of database software (such as from RDBMS to NoSQL or NoSQL going back to RDBMS), or if it’s just a data migration, performing a migration is a huge amount of work and costs. 

A database migration will always involve the process of migrating data from one or more source databases to one or more target databases. This can involve a database migration service or a mashup set of tools that the engineers have built to create a service and tailor to this kind of problem. 

It is expected that a database migration does not mean the source database platform will end up its target platform to be exactly as the source of origin. Once a migration is finished, the dataset from the target databases could end up being possibly restructured. What matters most, once migration is fully done, is that the clients accessing the database shall be redirected to the newly source databases. The new source database has to provide the exact copy of data from source, and with no impacts to performance that may impact the overall user experience.

Moving your data from one platform to the target destination platform is a huge task to do. This is what a database migration covers when an organization or company decides to switch off its light to the current platform for numerous reasons. The common reasons for migrating data is because of cost effectiveness to the target destination platform or for its flexibility upon deployment and scalability. While the current platform hosting the current production data causes more costs for its upgrades and scalability wise, it is just burdensome when deploying small changes which can actually be deployed in a microservice platform.

In this blog we're going to put focus on the top open source tools you can use for MySQL and MariaDB migrations on a more homogeneous database migration.

Backup Tools For Data Migration

The most easy path to use when performing migration is to use database backup tools. We'll look at what these tools are and how you can use them during migration.

mysqldump/mysqlpump

This tool is one of the most famous utilities for MySQL or MariaDB that a database admin or system admin will hook this tool to migrate either a full database or a partial copy of the database. For database admins that are not familiar with MySQL/MariaDB, this tool will allow you to create a copy of backup which will generate a logical copy of data that you can dump on the target database. 

A common setup with using this tool is, whenever a target database is located somewhere else and is hosted on a different platform than the source, the target acts as a slave or replica. Using mysqldump commonly invoked with --single-transaction on a busy system, and with --master-data will provide you the coordinates to set up a slave on the target database which will be used as a host for data migration. An alternative to mysqldump is also mysqlpump but with a lesser feature yet can do parallel processing of databases, and of objects within databases, to speed up the dump process. The downside is that, with mysqlpump, there's no option you can use such as --master-data which is very useful if you want to create a replica which will be used as a target destination for database migration. 

mysqlpump is advantageous if your data is more of idle or is put into maintenance mode such that no processed writes or changes ongoing to the source database. It is faster and quicker compared to mysqldump.

mydumper/myloader 

mydumper/myloader is a very nifty and efficient tool that you can use for logical backup especially for importing bulk data with faster processing speed as it offers parallelism, ability to send data by chunks, supports threshold and control rate through number of threads, rows, statement size, and compress the result. It does generate or include binary log file and log positions which is very helpful if you setup the target destination platform to act as a replica of the current source and production environment. 

Basically, mydumper is the binary and the command you have to invoke via command line for creating the logical backup. Whereas, myloader is the binary and the command you have to use when loading data to the desired target destination. Its flexibility allows you to manage your desired rate when processing the actions whether its creating a backup or loading the data. Using mydumper, you can also create a full backup or just a partial backup copy of your source database. This is very useful in case you need a large data or schema that you wanted to move away from the current database host, and slightly move it to another target destination while starting to setup a new database shards. This can also be one way to migrate large data by pulling a huge segment of the dataset then moving it but as a new shard node.

mydumper/myloader has also its limitations. It has been stopped from updates from the original authors but saved by Max Bube yet the tool is still being widely used even for production environments.

Percona XtraBackup/MariaDB Backup

Percona's XtraBackup is a gift for database administrators that  do not want to use and spend money for the enterprise Oracle MySQL Enterprise Backup. Whereas MariaDB Backup is forked and derived from Percona XtraBackup, they also have MariaDB Enterprise Backup

Both of these tools share the same concepts when performing or taking a backup. It's a binary backup which offers a hot online backup, PITR, incremental and full backup, partial backup, also useful for data recovery as it understands recovery such that produces binary log file and position, supports GTID's, and a lot more. Although MariaDB Backup and Percona XtraBackup are two different types of software nowadays as they are architected onwards to support the database focused to provide a backup. MariaDB Backup is definitely applicable if you are intending to use or take backups from a MariaDB database source. Whereas, Percona XtraBackup is applicable on Oracle MySQL and also on Percona Server or some derived MySQL servers such as Percona XtraDB Server or Codership's version of Galera Cluster for MySQL.

Both backups are very beneficial for database migrations. Performing a hot online backup is quicker and faster and produces a backup that you can directly use to load it to your target database. More often, streaming backup is handy as well like you can perform an online backup and stream the binary data to the target database using socat or netcat. This allows you to shorten the time of migration since moving data to the target destination is being streamed directly. 

The most common approach of data migration while using this tool is to copy the data from the source then stream the data to the target destination. Once in the target database destination, you can just prepare the binary backup with --prepare option where it applies the logs that were recorded during the time of the backup creation so it will copy the full data as is and exactly from the point of time where the backup was taken. Then set the target database destination as a replica to act as a replica or slave of the existing source cluster and replicate all those changes and transactions that have occurred from the main cluster.

Of course there's a limitation as well of using this tool but database administrators must know how to use this tool and also how to throttle and customize the usage in accordance to its desired use. You might not want to bog down your source database if your source is taking too much traffic or large processing from that time. Its limitation also ensures that its a homogeneous setup where the target source is of Linux compatible system and not on a Windows type environment since Percona XtraBackup and MariaDB Backup operate only in the Linux environment.

Database Schema Migration Tools

Database migration does not speak itself only on a specific tool and a specific task, then migration can happen. There's a lot of considerations and underlying subsequent tasks that have to be done to fulfill a complete database migration. One of these is the schema migration or database migration. A schema in MySQL/MariaDB is a collection of data which consists of a group of tables with its columns and rows, events, triggers, stored procedures or routines, and functions. There are occasions when you might only want to migrate a schema or only a table. Let say a specific table on a schema requires a change in its table structure and that requires a DDL statement. The problem is that, running a direct DDL statement such as ALTER TABLE ...ENGINE=InnoDB blocks any incoming transactions or connections that will also refer or use to the target table. For some huge tables that comprises long data definition and structure of the table, it adds more real challenge and also complicates more especially if the table is a hot table. Whereas in a database migration, it can be hard to copy the exact full copy of the full table without downtime from source. So let's see what these are.

pt-online-schema-change

It's part of the famous Percona Toolkit which originally derived from Maatkit and Aspersa. This tool is very useful when performing a table definition change especially for a hot table consisting of a huge amount of data. For some common yet naive approach for performing a table definition change, running ALTER TABLE can do the job. Although it does suffice the case, ALTER TABLE without using ALGORITHM=INPLACE causes a full table copy which acquires a full-metadata lock and that means your database can possibly piled up and lock up for a long period of time, especially if the table is huge. In that case, this tool is built to solve that problem. This tool  is very beneficial for database migration in such a way that a detected inconsistent copy of a hot table with very huge data from your already setup target database destination. Instead of performing a backup either using a logical or binary/physical copy, pt-online-schema-change can be used which copies the rows from source table to its target table chunk-by-chunk. You can even customize the command with proper calls to its parameters depending on your requirements.

Aside from using, pt-online-schema-change also uses triggers. By using triggers, any subsequent or on-going traffic that tries to apply changes into that reference table shall also be copied to the target database which acts as a replica of the current source database cluster. This copies all data exactly what data that the source database has down to your target database that is lying on a different platform, for example. Using triggers is applicable to be used for MySQL and MariaDB as long as it's engine is InnoDB and has a primary key presence on that table, which is a requirement.  You may know that InnoDB uses a row-locking mechanism which allows that, for some number of chunks (a group of select records), pt-online-schema-change will try to copy that and then applies the INSERT statement to the target table. The target table is a dummy table which acts as a target copy of the soon-to-be replacement of the existing source table. pt-online-schema-change though allows the user to either remove the dummy table or just let the dummy table in-placed until the administrator is ready to remove that table. Take note that, dropping or removing a table acquires a meta-datalock. Since it acquires triggers, any subsequent changes shall be copied exactly to the target table leaving no discrepancy on the target or dummy table.

gh-ost

Shares the same concept as pt-online-schema-change. This tool approaches differently compared to pt-online-schema-change. I shall say, this schema tool migration approaches those production-based impediments that can cause your database to slow down and possibly stuck up causing your database cluster to go fall down under maintenance mode or down for an unknown period of time, until the problem is solved. This problem is caused usually with triggers. If you have a busy or hot table that is undergoing a schema change or table definition change, triggers can cause your database to piled up due to lock contention. MySQL/MariaDB triggers allow your database to define triggers for INSERT, UPDATE, and DELETE. If the target table is on a hotspot, then it can end up nasty. Your database starts to get slower until it gets stuck up unless you are able to kill those incoming queries or best to remove the triggers, but that's not what the ideal approach is all about.

Because of those issues, gh-ost addresses that problem. It acts as if there's a binary log server where the incoming events or transactions are logged in a binary log format, specifically using RBR (Row Based Replication). In fact, it is very safe and less worries in terms of impact you need to face. In fact, you have also the option to do a test or dry-run (same as with pt-online-schema-change) but test it directly into the replica or a slave node. This is perfect if you want to play around and check the exact copy to your target database during migration.

This tool is very flexible in accordance to your needs and implies assurance that your cluster shall not stuck up or probably end up performing a failover or data recovery if it goes worse. For more information and want to learn this tool, I suggest reading this post from Github by Shlomi Noach.

Other OSC Tools

I can say, those two tools are more of a recommendable approach but other alternatives you can also try. Mostly, these tools apply MySQL/MariaDB triggers so it somehow shares the same concept as pt-online-schema-change. Here's the following list:

  • LHM - Rails style database migrations are a useful way to evolve your data schema in an agile manner. Most Rails projects start like this, and at first, making changes is fast and easy.
  • OnlineSchemaChange - Created and initiated by Facebook. This tool is used for making schema changes for MySQL tables in a non-blocking way
  • TableMigrator - Initiated by Serious Business and ex-employees of Twitter. This tool shares the same principle with zero-downtime migrations of large tables in MySQL. It is implemented using Rails so it can be useful if you have a Ruby-on-Rails application environment.
  • oak-online-alter-table - this is an old tool created by Shlomi Noach though it's somehow approaches the same approach that pt-online-schema-change and does perform a non-blocking ALTER TABLE operation

Database Migration Wizard Tools

There are few migration tools that offer free usage which is very beneficial to some extent. What's more advantageous with using migration wizard tools is that they have GUI for which you can have the convenience to see the current structure or just follow the steps the UI provides during migration. There can be numerous services or wizard tools but it's not open source and it's not available for free. Of course, a database migration is a very complex yet a systematic process but for some cases, it requires large work and efforts. Let's take a look at these free tools.

MySQL Workbench

As the name suggests, it's for MySQL and derivative databases such as Percona Server for example, can be useful when it comes to database migration. Since MariaDB has totally shifted to a different route especially since the 10.2 version, there are some incompatibility issues you might encounter if you attempt to use this from a MariaDB source or target. Workbench can be used for heterogeneous types of databases such as those coming from different source databases and wants to dump the data to MySQL. 

The MySQL Workbench is composed of community and enterprise versions. Yet, the community version is freely available as GPL which you can find here https://github.com/mysql/mysql-workbench. As the documentation states, MySQL Workbench Allows you to migrate from Microsoft SQL Server, Microsoft Access, Sybase ASE, SQLite, SQL Anywhere, PostreSQL, and other RDBMS tables, objects and data to MySQL. Migration also supports migrating from earlier versions of MySQL to the latest releases.

phpMyAdmin

For those working as web developers using the LAMP stack, this tool comes to no surprise to be one of their swiss army knives when dealing with database tasks. phpMyAdmin is a free software tool written in PHP, intended to handle the administration of MySQL over the Web. phpMyAdmin supports a wide range of operations on MySQL and MariaDB. Frequently used operations (managing databases, tables, columns, relations, indexes, users, permissions, etc) can be performed via the user interface, while you still have the ability to directly execute any SQL statement.

Although it's quite simple when it comes to import and export, what's important is that it makes the job done. Although for larger and more complex migration, this might not suffice to handle your desired needs. 

HeidiSQL

HeidiSQL is free software, and has the aim to be easy to learn. "Heidi" lets you see and edit data and structures from computers running one of the database systems MariaDB, MySQL, Microsoft SQL, PostgreSQL and SQLite. Invented in 2002 by Ansgar, HeidiSQL belongs to the most popular tools for MariaDB and MySQL worldwide.

For migration purposes, it allows you to export from one server/database directly to another server/database. It also has import features to allow text fields such as CSV, and also export table rows also into a wide range of supported file types such as CSV, HTML, XML, SQL, LaTeX, Wiki Markup and PHP Array. Although it is built to manage databases for db server administration purposes, yet you can use this for simple migration stuff.

Percona Toolkit As Your Swiss Army Knife

Percona Toolkit is notable software being distributed as an open-source software under the warranty of GPL. Percona Toolkit is a collection of advanced command-line tools commonly used internally by Percona but it's also applicable for any database work related especially for MySQL/MariaDB servers. 

So how and why is it also helpful for data migration especially in MySQL/MariaDB migrations? They have a number of tools here which is beneficial to use upon migration and after migration. 

As mentioned earlier, a common approach of data migration is to have the target destination server as a replica of the main source database cluster but in a homogeneous setup. This means that, if the situation is moving from on-prem to a public cloud provider, you can setup an elected node from that platform and this node will replicate all transactions from the main cluster. By using backup tools, you may be able to achieve this type of migration setup. But it doesn't end there. Percona Toolkit has pt-table-checksum/pt-table-sync tools for example in order to help you identify data inconsistencies between on-prem versus the target destination database server. With pt-table-checksum, you can perform checksum calculations based on a series of chunks for all databases or just selectively checksum on particular databases, or particular tables, or even a range of records of the table. pt-table-sync will be used to perform data synchronization so your target databases will be refreshed again with a new copy of the exact data from the main source cluster.

On the other hand, pt-upgrade is very useful after the migration from backup tools is performed. With pt-upgrade, you can use this tool to perform analysis by running a set of queries, for example, from a slow query log file. These results can be used to compare from the source database and against the target database server.

Summary

Database migration, especially from a heterogeneous setup, can be very complicated. Yet on a homogenous setup it can be quite straightforward; regardless if the data is large or small as long as you are equipped with proper tools and, of course, the correct systematic approach to determine that migration is complete with data being consistent. There can be times when a migration requires consultation with the experts, but it's always a great start to come up and try with these open source tools to achieve your desired database migration task.


Migrating Amazon RDS (MySQL or MariaDB) to an On-Prem Server

$
0
0

Amazon Web Services is a technology giant, especially when it comes to pioneering itself in top-of-the-line cloud computing services. Its fully managed services products (Amazon RDS) is one of a kind. But then again, while it can be a perfect platform for some organizations, it can be a challenge to move out from it if it’s not. There are always concerns of being stuck in a vendor lock-in situation.

Some things to keep in mind when migrating from RDS to an on-premise platform are budget constraints, security, and data autonomy. This is because data is your most valuable asset and retaining control wherever it resides, it is always imperative for the organization and company to always remain competitive. No organization can afford to have cloud lock-in, and yet, many enterprises find themselves exactly in that situation and start hopping searching for any alternative existing solutions that can be operable via on-prem.

This blog will walk you through how to migrate from Amazon RDS going to an on-prem server. Our target database on the on-prem server is on a RHEL/CentOS Linux server, but the applicable procedure shall apply on other versions of Linux as well as long as packages are properly installed. 

There are some third-party existing solutions that offer data migration but it's not applicable for an on-premise platform. Additionally, it is not free and migrating using free with open source solutions is always favorable and advantageous. Though doubts and concerns also exist since the warranty and support is not bound with open-source technologies but we will show you here how to achieve this in a straightforward procedure.

Since Amazon RDS supports compatibility with MySQL and MariaDB. We will focus on them for this blog.

Migrating from Amazon RDS for MySQL or MariaDB

A typical approach of migrating your data from Amazon RDS to an on-prem server is to take a backup using a logical copy. This can be done using backup utility solutions that are compatible to operate with Amazon RDS which is a fully-managed service. Fully-managed database services do not offer SSH logins so physical copy of backups is not an option.

Using mysqldump

Using mysqldump has to be installed in your target database node located on-prem. It has to be prepared as a replica of the AWS RDS node so all subsequent transactions shall be replicated to the node. To do this, follow the steps below.

AWS RDS source host: database-1.xxxxxxx.us-east-2.rds.amazonaws.com

On-Prem Server Host: 192.168.10.226 (testnode26)

Before starting the dump, make sure that the binlog retention hours is set. To set it, you can do like the example procedure call below in your Amazon RDS instance,

mysql> call mysql.rds_set_configuration('binlog retention hours', 24);

Query OK, 2 rows affected (0.23 sec)


mysql> CALL mysql.rds_show_configuration;

+------------------------+-------+------------------------------------------------------------------------------------------------------+

| name                   | value | description                                                                                          |

+------------------------+-------+------------------------------------------------------------------------------------------------------+

| binlog retention hours | 24    | binlog retention hours specifies the duration in hours before binary logs are automatically deleted. |

+------------------------+-------+------------------------------------------------------------------------------------------------------+

1 row in set (0.23 sec)


Query OK, 0 rows affected (0.23 sec)

Install mysqldump

  1. Prepare the repository. 

# For MySQL

$ yum install https://dev.mysql.com/get/mysql80-community-release-el7-3.noarch.rpm

# For MariaDB

$ curl -sS https://downloads.mariadb.com/MariaDB/mariadb_repo_setup | sudo bash
  1. Install mysql-client package

# For MySQL

$ yum install -y mysql-community-client.x86_64

# For MariaDB

$ yum install -y MariaDB-client
  1. Create a data dump using mysqldump by executing it inside the target node. Take note, with --master-data=2 specified as an option, this works only for MariaDB but not in MySQL. So extra-work for MySQL has to be done. We'll talk on this later.

## Applicable for MariaDB approach

[root@testnode26 ~]# mysqldump -h database-1.xxxxxxx.us-east-2.rds.amazonaws.com -uadmin -p --single-transaction --master-data=2 --databases db1 db2 db3  > backups/dump.sql

Enter password:

[root@testnode26 ~]# ls -alth backups/dump.sql

-rw-r--r--. 1 root root 196M Oct 18 02:34 backups/dump.sql
  1. Install the MySQL/MariaDB Server in the target database node

# For MySQL (always check what version repository is enabled in your yum repository. At this point, I'm using MySQL 5.7)

$ yum --disablerepo=* --enablerepo=mysql57-community install mysql-community-common mysql-community-client mysql-community-server

# For MariaDB

$ yum install MariaDB-server.x86_64
  1. Setup the MySQL/MariaDB Server instance (my.cnf, file permissions, directories), and start the server 

# Setting up the my.cnf (using the my.cnf deployment use by ClusterControl)

[MYSQLD]

user=mysql

basedir=/usr/

datadir=/var/lib/mysql

socket=/var/lib/mysql/mysql.sock

pid_file=/var/lib/mysql/mysql.pid

port=3306

log_error=/var/log/mysql/mysqld.log

log_warnings=2

slow_query_log_file=/var/log/mysql/mysql-slow.log

long_query_time=2

slow_query_log=OFF

log_queries_not_using_indexes=OFF

innodb_buffer_pool_size=2G

innodb_flush_log_at_trx_commit=2

innodb_file_per_table=1

innodb_data_file_path=ibdata1:100M:autoextend

innodb_read_io_threads=4

innodb_write_io_threads=4

innodb_doublewrite=1

innodb_log_file_size=256M

innodb_log_buffer_size=32M

innodb_buffer_pool_instances=1

innodb_log_files_in_group=2

innodb_thread_concurrency=0

innodb_flush_method=O_DIRECT

innodb_rollback_on_timeout=ON

innodb_autoinc_lock_mode=2

innodb_stats_on_metadata=0

default_storage_engine=innodb

server_id=1126

binlog_format=ROW

log_bin=binlog

log_slave_updates=1

relay_log=relay-bin

expire_logs_days=7

read_only=OFF

report_host=192.168.10.226

key_buffer_size=24M

tmp_table_size=64M

max_heap_table_size=64M

max_allowed_packet=512M

skip_name_resolve=true

memlock=0

sysdate_is_now=1

max_connections=500

thread_cache_size=512

query_cache_type=0

query_cache_size=0

table_open_cache=1024

lower_case_table_names=0

performance_schema=OFF

performance-schema-max-mutex-classes=0

performance-schema-max-mutex-instances=0


[MYSQL]

socket=/var/lib/mysql/mysql.sock


[client]

socket=/var/lib/mysql/mysql.sock


[mysqldump]

socket=/var/lib/mysql/mysql.sock

max_allowed_packet=512M

            ## Reset the data directory and re-install the database system files

$ rm -rf /var/lib/mysql/*

## Create the log directories

$ mkdir /var/log/mysql

$ chown -R mysql.mysql /var/log/mysql

## For MySQL

$ mysqld --initialize

## For MariaDB

$ mysql_install_db


  1. Start the MySQL/MariaDB Server

## For MySQL

$ systemctl start mysqld

## For MariaDB

$ systemctl start mariadb
  1. Load the data dump we have taken from AWS RDS to the target database node on-prem

$ mysql --show-warnings < backups/dump.sql
  1. Create the replication user from the AWS RDS source node

MariaDB [(none)]> CREATE USER 'repl_user'@'149.145.213.%' IDENTIFIED BY 'repl_passw0rd';

Query OK, 0 rows affected (0.242 sec)


MariaDB [(none)]>  GRANT REPLICATION CLIENT, REPLICATION SLAVE ON *.* TO repl_user'@'149.145.213.%'  IDENTIFIED BY 'repl_passw0rd' ;

Query OK, 0 rows affected (0.229 sec)
  1. Set up the MySQL/MariaDB Server as a replica/slave of the AWS RDS source node

## First, let's search or locate the CHANGE MASTER command

[root@testnode26 ~]# grep -rn -E -i 'change master to master' backups/dump.sql |head -1

22:-- CHANGE MASTER TO MASTER_LOG_FILE='mysql-bin-changelog.000584', MASTER_LOG_POS=421;

## Run the CHANGE MASTER statement but add the replication user/password and the hostname as follows,

MariaDB [(none)]> CHANGE MASTER TO MASTER_HOST='database-1.xxxxxxx.us-east-2.rds.amazonaws.com', MASTER_LOG_FILE='mysql-bin-changelog.000584', MASTER_LOG_POS=421, MASTER_USER='repl_user', MASTER_PASSWORD='repl_passw0rd';

Query OK, 0 rows affected (0.004 sec)

## Then start the slave threads

MariaDB [(none)]> START SLAVE;

Query OK, 0 rows affected (0.001 sec)

## Check the slave status how it goes

MariaDB [(none)]> SHOW SLAVE STATUS \G

*************************** 1. row ***************************

                Slave_IO_State: Waiting for master to send event

                   Master_Host: database-1.xxxxxxx.us-east-2.rds.amazonaws.com

                   Master_User: repl_user

                   Master_Port: 3306

                 Connect_Retry: 60

               Master_Log_File: mysql-bin-changelog.000584

           Read_Master_Log_Pos: 421

                Relay_Log_File: relay-bin.000001

                 Relay_Log_Pos: 4

         Relay_Master_Log_File: mysql-bin-changelog.000584

              Slave_IO_Running: Yes

             Slave_SQL_Running: Yes

               Replicate_Do_DB:

           Replicate_Ignore_DB:

            Replicate_Do_Table:

        Replicate_Ignore_Table:

       Replicate_Wild_Do_Table:

   Replicate_Wild_Ignore_Table:

                    Last_Errno: 0

                    Last_Error:

                  Skip_Counter: 0

           Exec_Master_Log_Pos: 421

               Relay_Log_Space: 256

               Until_Condition: None

                Until_Log_File:

                 Until_Log_Pos: 0

            Master_SSL_Allowed: No

            Master_SSL_CA_File:

            Master_SSL_CA_Path:

               Master_SSL_Cert:

             Master_SSL_Cipher:

                Master_SSL_Key:

         Seconds_Behind_Master: 0

 Master_SSL_Verify_Server_Cert: No

                 Last_IO_Errno: 0

                 Last_IO_Error:

                Last_SQL_Errno: 0

                Last_SQL_Error:

   Replicate_Ignore_Server_Ids:

              Master_Server_Id: 1675507089

                Master_SSL_Crl:

            Master_SSL_Crlpath:

                    Using_Gtid: No

                   Gtid_IO_Pos:

       Replicate_Do_Domain_Ids:

   Replicate_Ignore_Domain_Ids:

                 Parallel_Mode: optimistic

                     SQL_Delay: 0

           SQL_Remaining_Delay: NULL

       Slave_SQL_Running_State: Slave has read all relay log; waiting for more updates

              Slave_DDL_Groups: 0

Slave_Non_Transactional_Groups: 0

    Slave_Transactional_Groups: 0

1 row in set (0.000 sec)

Now that we have finally been able to replicate from RDS as the source or master of our replica located on-prem. It's not done yet. There are some cases you'll encounter replication errors such as,      

Last_SQL_Errno: 1146

                Last_SQL_Error: Error 'Table 'mysql.rds_heartbeat2' doesn't exist' on query. Default database: 'mysql'. Query: 'INSERT INTO mysql.rds_heartbeat2(id, value) values (1,1602988485784) ON DUPLICATE KEY UPDATE value = 1602988485784'

 Since on-prem does not need to replicate data coming from mysql database for tables prefixed with 'rds%', then we just ignore these tables during replication. Additionally, you might not want AWS RDS to update and change your mysql.user table. To do this, you can optionally ignore the schema or just list of tables such as,

STOP SLAVE;

Then,

SET GLOBAL replicate_wild_ignore_table='mysql.rds%';

or

SET GLOBAL replicate_wild_ignore_table='mysql.%';

The MySQL Problem With --master-data=2

Taking the mysqldump with --master-data=2 requires sufficient privileges which requires SUPER and RELOAD privileges. The problem is, AWS RDS does not supply this for the admin user during database setup and creation. In order to workaround this issue, it must be that your AWS RDS has a master and a replica or slave setup. Once you have a slave setup, take that as the target source host when taking mysqldump. Then stop the slave threads from your AWS RDS replica as follows,

rds-replica-mysql> CALL mysql.rds_stop_replication;

Then take the mysqldump without the --master-data option just like below,

mysqldump -h database-1.xxxxxxx.us-east-2.rds.amazonaws.com -uadmin -p --single-transaction --databases db1 db2 db3  > backups/dump.sql

Then run the SHOW SLAVE STATUS\G from your AWS RDS replica and take note of the  Master_Log_File and Exec_Master_Log_Pos for which you will use when connecting to the AWS RDS master replicating to your on-prem server. Use those coordinates when running CHANGE MASTER TO… MASTER_LOG_FILE=Master_Log_File, MASTER_LOG_POS=<Exec_Master_Log_Pos>. Of course, once the backup has been done, do not forget to start your RDS replica to start its replication threads again,

rds-replica-mysql> CALL mysql.rds_start_replication;

Using mydumper

mydumper can be your alternative option here especially when the dataset is very large as it offers parallelism and speed when taking a dump or backup copy of your dataset from a source RDS node. Follow the steps below from installing the mydumper to loading it to your destination on-prem server.

  1. Install the binary. The binaries can be located here https://github.com/maxbube/mydumper/releases.

 $ yum install https://github.com/maxbube/mydumper/releases/download/v0.9.5/mydumper-0.9.5-2.el6.x86_64.rpm
  1. Take the backup from the RDS source node. For example,

[root@testnode26 mydumper-2]# /usr/bin/mydumper --outputdir=. --verbose=3 --host=database-1.xxxxxxx.us-east-2.rds.amazonaws.com --port=3306 --kill-long-queries --chunk-filesize=5120 --build-empty-files --events --routines --triggers --compress --less-locking --success-on-1146 --regex='(db1\.|db2\.|db3\.|mydb4\.|testdb5\.)' -u admin --password=admin123

** Message: Connected to a MySQL server


** (mydumper:18904): CRITICAL **: Couldn't acquire global lock, snapshots will not be consistent: Access denied for user 'admin'@'%' (using password: YES)

** Message: Started dump at: 2020-10-18 09:34:08


** Message: Written master status

** Message: Multisource slave detected.

** Message: Thread 5 connected using MySQL connection ID 1109

Now, at this point, mydumper will take a backup files in the form of *.gz files

  1. Load it to your destination on-premise server

$ myloader --host localhost --directory=$(pwd) --queries-per-transaction=10000 --threads=8 --compress-protocol --verbose=3

** Message: 8 threads created

** Message: Creating database `db1`

** Message: Creating table `db1`.`folders_rel`

** Message: Creating table `db2`.`p`

** Message: Creating table `db2`.`t1`

** Message: Creating table `db3`.`AddressCodeTest`
  1. Setup the destination node as a slave/replica. mydumper will include a file called metadata which consists of binary log coordinates including GTID positions, for example:                                                                                                                                                                         

$ cat metadata

Started dump at: 2020-10-18 10:23:35

SHOW MASTER STATUS:

        Log: mysql-bin-changelog.000680

        Pos: 676

        GTID:0-1675507089-3044

## Then run a change master from the replica or your target destination MySQL/MariaDB database node

MariaDB [jbmrcd_date]> CHANGE MASTER TO MASTER_HOST='database-1.cmu8qdlvkepg.us-east-2.rds.amazonaws.com', MASTER_USER='repl_user', MASTER_PASSWORD='repl_passw0rd',  MASTER_LOG_FILE='mysql-bin-changelog.000680', MASTER_LOG_POS

=676;

Query OK, 0 rows affected (0.002 sec)

## Start the slave

MariaDB [jbmrcd_date]> start slave;

Query OK, 0 rows affected (0.001 sec)

At this point, you have now replicated from an Amazon RDS instance running MySQL/MariaDB. Once your application is ready to move away from your Amazon RDS instance, setup the endpoint going to your on-prem server and all remaining transactions from your RDS instance will be replicated to your on-prem leaving no data being missed going to your on-prem server.

Check For Data Discrepancies

Once you have your data loaded or dumped to your on-prem server acting as a replica from the AWS RDS instance, you should double check this by running checksum calculations to determine how far your data is against the source Amazon RDS. I suggest you use pt-table-checksum tool by Percona, but you can create your own though by using checksumming tools such as md5 or sha256 but this takes time to do. Additionally, using pt-upgrade can help as well after your data migration using this replication approach is done.

Conclusion

Using mysqldump or mydumper are free open-source tools which is a great advantage as well especially if your data is very confidential and you do not want a third-party to access it. Although it might be simple to take this approach, there can be tedious and large work that can be involved as testing and double checks always follow in order to prove that migration is fully achieved without any data inconsistencies.

Migrating Google Cloud SQL for MySQL to an On-Prem Server

$
0
0

Google Cloud SQL for MySQL is a fully-managed database service that helps you set up, maintain, manage, and administer your MySQL relational databases on Google Cloud Platform. However, there are differences between Cloud SQL and standard MySQL functionality like limited control, restricted resources, data locality, budget and security, which may influence your final decision to move out from the Google Cloud SQL instances and host the database service in the on-premises infrastructure instead.

This blog post will walk you through how to perform online migration from Google Cloud SQL to an on-premises server. Our target database on the on-premises server is a Debian server, but the steps and procedures shall apply on other versions of Linux as well as long as packages are properly installed.

Our Google Cloud MySQL instance is running on MySQL 5.7 and what we need is:

  • A replication slave user created on the master.
  • The slave must be installed with the same major version as the master.
  • SSL must be enabled for geographical replication for security reasons.

Since Google Cloud by default enabled GTID replication for MySQL, we are going to do a migration based on this replication scheme. Hence, the instructions described in this post should also work in MySQL 8.0 instances.

Creating a Replication Slave User

First of all, we have to create a replication slave user on our Google Cloud SQL instance. Log in to the Google Cloud Platform -> Databases -> SQL -> pick the MySQL instance -> Users -> Add User Account and enter the required details:

Google Cloud SQL Creating a Replication Slave User

The 202.187.194.255 is the slave public IP address located in our on-premises that is going to replicate from this instance. As you can see, there is no privileges configuration since users created from this interface will have the highest privileges Google Cloud SQL can offer (almost everything except SUPER and FILE). To verify the privileges, we can use the following command:

mysql> SHOW GRANTS FOR slave@202.187.194.255\G
*************************** 1. row ***************************
Grants for slave@202.187.194.255: GRANT SELECT, INSERT, UPDATE, DELETE, CREATE, 
DROP, RELOAD, SHUTDOWN, PROCESS, REFERENCES, INDEX, ALTER, SHOW DATABASES, 
CREATE TEMPORARY TABLES, LOCK TABLES, EXECUTE, REPLICATION SLAVE, REPLICATION CLIENT, 
CREATE VIEW, SHOW VIEW, CREATE ROUTINE, ALTER ROUTINE, CREATE USER, EVENT, TRIGGER, 
CREATE TABLESPACE ON *.* TO 'slave'@'202.187.194.255' WITH GRANT OPTION

It looks like our slave user has the required permission to run as a slave (REPLICATION SLAVE).

Taking a mysqldump Backup

Before we create an external mysqldump backup, we need to configure the client's SSL certificates because of the risk of connecting the instance via a public network. To do this, go to Connections -> Configure SSL client certificates -> Create a client certificate:

Taking a mysqldump Backup Google Cloud SQL

Download the above files (server-ca.pem, client-cert.pem and client-key.pem) and store them inside the slave server. We are going to use these certificates to connect to the master securely from the slave serve. To simplify the process, all of the above certificates and key file will be put under a directory called "gcloud-certs":

$ mkdir -p /root/gcloud-certs # put the certs/key here

Make sure the permissions are correct, especially the private key file, client-key.pem:

$ chmod 600 /root/gcloud-certs/client-key.pem

Now we are ready to take a mysqldump backup from our Google Cloud SQL MySQL 5.7 instance securely:

$ mysqldump -uroot -p \
-h 35.198.197.171 \
--ssl-ca=/root/gcloud-certs/server-ca.pem \
--ssl-cert=/root/gcloud-certs/client-cert.pem \
--ssl-key=/root/gcloud-certs/client-key.pem \
--single-transaction \
--all-databases \
--triggers \
--routines > fullbackup.sql

You should get the following warning:

"Warning: A partial dump from a server that has GTIDs will by default include the GTIDs of all transactions, even those that changed suppressed parts of the database. If you don't want to restore GTIDs, pass --set-gtid-purged=OFF. To make a complete dump, pass --all-databases --triggers --routines --events."

The above warning occurs because we skipped defining the --events flag which requires the SUPER privilege. The root user created for every Google Cloud SQL instance does not come with FILE and SUPER privileges. This is one of the drawbacks of using this method, that MySQL Events can't be imported from Google Cloud SQL.

Configuring the Slave Server

On the slave server, install MySQL 5.7 for Debian 10:

$ echo 'deb http://repo.mysql.com/apt/debian/ buster mysql-5.7'> /etc/apt/sources.list.d/mysql.list
$ apt-key adv --keyserver pgp.mit.edu --recv-keys 5072E1F5
$ apt update
$ apt -y install mysql-community-server

Then, add the following lines under the [mysqld] section inside /etc/mysql/my.cnf (or any other relevant MySQL configuration file):

server-id = 1111 # different value than the master
log_bin = binlog
log_slave_updates = 1
expire_logs_days = 7
binlog_format = ROW
gtid_mode = ON
enforce_gtid_consistency = 1
sync_binlog = 1
report_host = 202.187.194.255 # IP address of this slave

Restart the MySQL server to apply the above changes:

$ systemctl restart mysql

Restore the mysqldump backup on this server:

$ mysql -uroot -p < fullbackup.sql

At this point, the MySQL root password of the slave server should be identical to the one in Google Cloud SQL. You should log in with a different root password from now on.

Take note that the root user in Google Cloud doesn't have full privileges. We need to make some modifications on the slave side, by allowing the root user to have all the privileges inside MySQL, since we have more control over this server. To do this, we need to update MySQL's user table. Login to the slave's MySQL server as MySQL root user and run the following statement:

mysql> UPDATE mysql.user SET Super_priv = 'Y', File_priv = 'Y' WHERE User = 'root';
Query OK, 1 row affected (0.00 sec)
Rows matched: 1  Changed: 1  Warnings: 0

Flush the privileges table:

mysql> FLUSH PRIVILEGES;
Query OK, 0 rows affected (0.00 sec)

Exit the current terminal and re-login again. Run the following command to verify that the root user now has the highest level of privileges:

mysql> SHOW GRANTS FOR root@localhost;
+---------------------------------------------------------------------+
| Grants for root@localhost                                           |
+---------------------------------------------------------------------+
| GRANT ALL PRIVILEGES ON *.* TO 'root'@'localhost' WITH GRANT OPTION |
+---------------------------------------------------------------------+

Setting up the Replication Link

For security reasons, the replication slave user has to connect to the master host (Google Cloud instance) via an SSL encrypted channel. Therefore, we have to prepare the SSL key and certificate with correct permission and accessible by the mysql user. Copy the gcloud directory into /etc/mysql and assign the correct permission and ownership:

$ mkdir -p /etc/mysql
$ cp /root/gcloud-certs /etc/mysql
$ chown -Rf mysql:mysql /etc/mysql/gcloud-certs

On the slave server, configure the replication link as below:

mysql> CHANGE MASTER TO MASTER_HOST = '35.198.197.171', 
MASTER_USER = 'slave', 
MASTER_PASSWORD = 'slavepassword', 
MASTER_AUTO_POSITION = 1, 
MASTER_SSL = 1, 
MASTER_SSL_CERT = '/etc/mysql/gcloud-certs/client-cert.pem', 
MASTER_SSL_CA = '/etc/mysql/gcloud-certs/server-ca.pem', 
MASTER_SSL_KEY = '/etc/mysql/gcloud-certs/client-key.pem';

Then, start the replication slave:

mysql> START SLAVE;

Verify the output as the following:

mysql> SHOW SLAVE STATUS\G
*************************** 1. row ***************************
               Slave_IO_State: Waiting for master to send event
                  Master_Host: 35.198.197.171
                  Master_User: slave
                  Master_Port: 3306
                Connect_Retry: 60
              Master_Log_File: mysql-bin.000003
          Read_Master_Log_Pos: 1120160
               Relay_Log_File: puppet-master-relay-bin.000002
                Relay_Log_Pos: 15900
        Relay_Master_Log_File: mysql-bin.000003
             Slave_IO_Running: Yes
            Slave_SQL_Running: Yes
              Replicate_Do_DB:
          Replicate_Ignore_DB:
           Replicate_Do_Table:
       Replicate_Ignore_Table:
      Replicate_Wild_Do_Table:
  Replicate_Wild_Ignore_Table:
                   Last_Errno: 0
                   Last_Error:
                 Skip_Counter: 0
          Exec_Master_Log_Pos: 1120160
              Relay_Log_Space: 16115
              Until_Condition: None
               Until_Log_File:
                Until_Log_Pos: 0
           Master_SSL_Allowed: Yes
           Master_SSL_CA_File: /etc/mysql/gcloud-certs/server-ca.pem
           Master_SSL_CA_Path:
              Master_SSL_Cert: /etc/mysql/gcloud-certs/client-cert.pem
            Master_SSL_Cipher:
               Master_SSL_Key: /etc/mysql/gcloud-certs/client-key.pem
        Seconds_Behind_Master: 0
Master_SSL_Verify_Server_Cert: No
                Last_IO_Errno: 0
                Last_IO_Error:
               Last_SQL_Errno: 0
               Last_SQL_Error:
  Replicate_Ignore_Server_Ids:
             Master_Server_Id: 2272712871
                  Master_UUID: 8539637e-14d1-11eb-ae3c-42010a94001a
             Master_Info_File: /var/lib/mysql/master.info
                    SQL_Delay: 0
          SQL_Remaining_Delay: NULL
      Slave_SQL_Running_State: Slave has read all relay log; waiting for more updates
           Master_Retry_Count: 86400
                  Master_Bind:
      Last_IO_Error_Timestamp:
     Last_SQL_Error_Timestamp:
               Master_SSL_Crl:
           Master_SSL_Crlpath:
           Retrieved_Gtid_Set: 8539637e-14d1-11eb-ae3c-42010a94001a:5611-5664
            Executed_Gtid_Set: 8539637e-14d1-11eb-ae3c-42010a94001a:1-5664,
b1dabe58-14e6-11eb-840f-0800278dc04d:1-2
                Auto_Position: 1
         Replicate_Rewrite_DB:
                 Channel_Name:
           Master_TLS_Version:

Make sure the Slave_IO_Running and Slave_SQL_Running values are 'Yes', as well as Seconds_Behind_Master should be 0, which means the slave has caught up with the master. Notice the Executed_Gtid_Set has two GTIDs:

  • 8539637e-14d1-11eb-ae3c-42010a94001a:1-5664
  • b1dabe58-14e6-11eb-840f-0800278dc04d:1-2

The first GTID represents the changes coming from the current master (Google Cloud SQL instance), while the second GTID represents the changes that we have made when we modified the privileges for the MySQL root user on the slave host. Pay attention to the first GTID to see if the database is replicating correctly (the integer part should be incrementing while replicating).

Verify if our slave host is part of the replication from the master's point-of-view. Login to the SQL Cloud instance as root:

$ mysql -uroot -p \
-h 35.198.197.171 \
--ssl-ca=/root/gcloud-certs/server-ca.pem \
--ssl-cert=/root/gcloud-certs/client-cert.pem \
--ssl-key=/root/gcloud-certs/client-key.pem

And run the following statement:

mysql> SHOW SLAVE HOSTS;
*************************** 1. row ***************************
 Server_id: 1111
      Host: 202.187.194.255
      Port: 3306
 Master_id: 2272712871
Slave_UUID: b1dabe58-14e6-11eb-840f-0800278dc04d

At this point, you may plan your next move to redirect the database workload from the applications to this slave server as the new master and decommission the old master in Google Cloud.

Final Thoughts

You can perform an online migration from Google Cloud SQL for MySQL to an on-premises server without much hassle. This gives you the possibility to move your database outside of the cloud vendors for privacy and control when the right time has come.

Migrating Azure Database for MySQL/MariaDB to an On-Prem Server

$
0
0

Database migrations can impose huge challenges when you consider how to start, what tools to use, and how to achieve a full database migration successfully. Earlier, we have listed the top open source you can use on migration for MySQL or MariaDB. In this blog, we'll show you how to migrate data from Microsoft Azure Database for MySQL or MariaDB.

Microsoft Azure is now known to be a contender against the two other cloud tech giants: AWS and Google Cloud. It specializes more of its Microsoft products specially their home grown MSSQL proprietary database. But not only that, it also has open sources as one of their fully managed service databases to offer publicly. Among its supported databases are MySQL and MariaDB.

Moving out from Azure Database for MySQL/MariaDB can be tedious but it depends on what type of architecture and what type of dataset you have hosted in your Azure as your current cloud provider. With the right tools, it can be achievable and a full migration can be done.

We'll focus on the tools we can use for data migrations on MySQL or MariaDB. For this blog, I'm using RHEL/CentOS to install the required packages. Let's go over and define the steps and procedures on how to do this.

Migrating From Azure Database for MySQL or MariaDB

A typical approach of migrating your data from Azure Database to an on-prem server is to take a backup using a logical copy. This can be done using backup utility solutions that are compatible to operate with Azure Database for MySQL or MariaDB which is a fully-managed service. Fully-managed database services do not offer SSH logins so physical copy of backups is not an option.

Before you can migrate or dump your existing database from Azure, you have to take note of the following considerations.

Common Use-cases For Dump and Restore On-Prem

Most common use-cases are:

  • Using logical backup (such as mysqldump, mysqlpump or mydumper/myloader) and restore is the only option. Azure Database for MySQL or MariaDB does not support physical access to the physical storage as this is a fully-managed database service.
  • Supports only InnoDB and Memory storage engines. Migrating from alternative storage engines to InnoDB. Azure Database for MySQL or MariaDB supports only InnoDB Storage engine, and therefore does not support alternative storage engines. If your tables are configured with other storage engines, convert them into the InnoDB engine format before migration to Azure Database for MySQL.
  • For example, if you have a WordPress or WebApp using the MyISAM tables, first convert those tables by migrating into InnoDB format before restoring to Azure Database for MySQL. Use the clause ENGINE=InnoDB to set the engine used when creating a new table, then transfer the data into the compatible table before the restore.
  • If your source Azure Database is on a specific version, then your target on-premise server has also been the same version as the source Azure Database.

So with these limitations, you only expect that your data from Azure has to be InnoDB storage engine or Memory, if there's such in your dataset.

Performance Considerations For Taking Logical Backup from Azure Database

The only way to take a logical backup with Azure is to use mysqldump or mysqlpump. To optimize performance when taking a dump using these tools, take notice of these considerations when dumping large databases:

  • Use the exclude-triggers option in mysqldump when dumping databases. Exclude triggers from dump files to avoid the trigger commands firing during the data restore.
  • Use the single-transaction option to set the transaction isolation mode to REPEATABLE READ and send a START TRANSACTION SQL statement to the server before dumping data. Dumping many tables within a single transaction causes some extra storage to be consumed during restore. The single-transaction option and the lock-tables option are mutually exclusive because LOCK TABLES causes any pending transactions to be committed implicitly. To dump large tables, combine the single-transaction option with the quick option.
  • Use the extended-insert multiple-row syntax that includes several VALUE lists. This results in a smaller dump file and speeds up inserts when the file is reloaded.
  • Use the order-by-primary option in mysqldump when dumping databases, so that the data is scripted in primary key order.
  • Use the disable-keys option in mysqldump when dumping data, to disable foreign key constraints before load. Disabling foreign key checks provides performance gains. Enable the constraints and verify the data after the load to ensure referential integrity.
  • Use partitioned tables when appropriate.
  • Load data in parallel. Avoid too much parallelism that would cause you to hit a resource limit, and monitor resources using the metrics available in the Azure portal.
  • Use the defer-table-indexes option in mysqlpump when dumping databases, so that index creation happens after the table's data is loaded.
  • Use the skip-definer option in mysqlpump to omit definer and SQL SECURITY clauses from the create statements for views and stored procedures. When you reload the dump file, it creates objects that use the default DEFINER and SQL SECURITY values.
  • Copy the backup files to an Azure blob/store and perform the restore from there, which should be a lot faster than performing the restore across the Internet.

Unsupported

The following are unsupported:

  • DBA role: Restricted. Alternatively, you can use the administrator user (created during new server creation), allows you to perform most of DDL and DML statements.
  • SUPER privilege: Similarly, SUPER privilege is restricted.
  • DEFINER: Requires super privileges to create and is restricted. If importing data using a backup, remove the CREATE DEFINER commands manually or by using the --skip-definer command when performing a mysqldump.
  • System databases: The mysql system database is read-only and used to support various PaaS functionality. You cannot make changes to the mysql system database.
  • SELECT ... INTO OUTFILE: Not supported in the service.

Using mysqldump

Using mysqldump has to be installed in your target database node located on-prem. It has to be prepared as a replica of the Azure Database node so all subsequent transactions shall be replicated to the node. To do this, follow the steps below.

Install mysqldump

  1. Prepare the repository. 

# For MySQL

$ yum install https://dev.mysql.com/get/mysql80-community-release-el7-3.noarch.rpm

# For MariaDB

$ curl -sS https://downloads.mariadb.com/MariaDB/mariadb_repo_setup | sudo bash


  1. Install mysql-client package

# For MySQL

$ yum install -y mysql-community-client.x86_64

# For MariaDB

$ yum install -y MariaDB-client
  1. Create a data dump using mysqldump by executing it inside the target node.

$ MYSQL_PWD=<YOUR_MYSQL_PASS> mysqldump -h<YOUR_AZURE_DB_HOSTNAME>  -u<YOUR_AZURE_USERNAME> --single-transaction --master-data=2 --extended-insert --order-by-primary --disable-keys --databases maximusdb db2 db3 > backups/dump.sql
  1. Install the MySQL/MariaDB Server in the target database node

# For MySQL

$  yum install mysql-community-server.x86_64 mysql-community-client mysql-community-common

# For MariaDB

$ yum install MariaDB-server.x86_64
  1. Setup the MySQL/MariaDB Server instance (my.cnf, file permissions, directories), and start the server 

# Setting up the my.cnf (using the my.cnf deployment use by ClusterControl)

[MYSQLD]

user=mysql

basedir=/usr/

datadir=/var/lib/mysql

socket=/var/lib/mysql/mysql.sock

pid_file=/var/lib/mysql/mysql.pid

port=3306

log_error=/var/log/mysql/mysqld.log

log_warnings=2

slow_query_log_file=/var/log/mysql/mysql-slow.log

long_query_time=2

slow_query_log=OFF

log_queries_not_using_indexes=OFF

innodb_buffer_pool_size=2G

innodb_flush_log_at_trx_commit=2

innodb_file_per_table=1

innodb_data_file_path=ibdata1:100M:autoextend

innodb_read_io_threads=4

innodb_write_io_threads=4

innodb_doublewrite=1

innodb_log_file_size=256M

innodb_log_buffer_size=32M

innodb_buffer_pool_instances=1

innodb_log_files_in_group=2

innodb_thread_concurrency=0

innodb_flush_method=O_DIRECT

innodb_rollback_on_timeout=ON

innodb_autoinc_lock_mode=2

innodb_stats_on_metadata=0

default_storage_engine=innodb

server_id=1126

binlog_format=ROW

log_bin=binlog

log_slave_updates=1

relay_log=relay-bin

expire_logs_days=7

read_only=OFF

report_host=192.168.10.226

key_buffer_size=24M

tmp_table_size=64M

max_heap_table_size=64M

max_allowed_packet=512M

skip_name_resolve=true

memlock=0

sysdate_is_now=1

max_connections=500

thread_cache_size=512

query_cache_type=0

query_cache_size=0

table_open_cache=1024

lower_case_table_names=0

performance_schema=OFF

performance-schema-max-mutex-classes=0

performance-schema-max-mutex-instances=0


[MYSQL]

socket=/var/lib/mysql/mysql.sock


[client]

socket=/var/lib/mysql/mysql.sock


[mysqldump]

socket=/var/lib/mysql/mysql.sock

max_allowed_packet=512M

## Reset the data directory and re-install the database system files

$ rm -rf /var/lib/mysql/*

## Create the log directories

$ mkdir /var/log/mysql

$ chown -R mysql.mysql /var/log/mysql

## For MySQL

$ mysqld --initialize

## For MariaDB

$ mysql_install_db
  1. Start the MySQL/MariaDB Server

## For MySQL

$ systemctl start mysqld

## For MariaDB

$ systemctl start mariadb
  1. Load the data dump we have taken from Azure Database to the target database node on-prem

$ mysql --show-warnings < backups/dump.sql
  1. Create the replication user from your Azure Database source node

CREATE USER 'repl_user'@'<your-target-node-ip>' IDENTIFIED BY 'repl_passw0rd';

GRANT REPLICATION CLIENT, REPLICATION SLAVE ON *.* TO repl_user@'<your-target-node-ip>' IDENTIFIED BY 'repl_passw0rd';

Make sure you change the IP address of your target node's IP address as the client to connect from.

  1. Set up the MySQL/MariaDB Server as a replica/slave of the Azure Database source node

## First, let's search or locate the CHANGE MASTER command

$ grep -rn -E -i 'change master to master' backups/dump.sql |head -1

22:-- CHANGE MASTER TO MASTER_LOG_FILE='mysql-bin.000006', MASTER_LOG_POS=2938610;

## Run the CHANGE MASTER statement but add the replication user/password and the hostname as follows,

CHANGE MASTER TO MASTER_HOST='<YOUR_AZURE_DB_HOSTNAME>', MASTER_LOG_FILE='mysql-bin.000006', MASTER_LOG_POS=2938610, MASTER_USER='repl_user', MASTER_PASSWORD='repl_passw0rd';

## In some cases, you might have to ignore the mysql schema. Run the following statement:

SET GLOBAL replicate_wild_ignore_table='mysql.%';

## Then start the slave threads

START SLAVE;

## Check the slave status how it goes

SHOW SLAVE STATUS \G

Now that we have finally been able to replicate from Azure Database either for MySQL/MariaDB as the source of your replica located on-prem. 

Using mydumper

Azure Database for MySQL or MariaDB in fact suggests that using mydumper specially for large backups such as 1TB can be your alternative option. It offers parallelism and speed when taking a dump or backup copy of your dataset from a source Azure Database node.

 Follow the steps below from installing the mydumper to loading it to your destination on-prem server.

  1. Install the binary. The binaries can be located here https://github.com/maxbube/mydumper/releases.

 $ yum install https://github.com/maxbube/mydumper/releases/download/v0.9.5/mydumper-0.9.5-2.el6.x86_64.rpm
  1. Take the backup from the Azure Database source node. For example,

[root@testnode26 mydumper]# MYSQL_PWD=<YOUR_AZURE_DB_PASSWORD> /usr/bin/mydumper --outputdir=. --verbose=3 --host=<YOUR_AZURE_DB_HOSTNAME>  -u <YOUR_AZURE_USER>@<YOUR_AZURE_DB_HOSTNAME> --port=3306 --kill-long-queries --chunk-filesize=5120 --build-empty-files --events --routines --triggers --compress --less-locking --success-on-1146 --regex='(maximusdb\.|db1\.|db2\.)'

** Message: Connected to a MySQL server

** Message: Using Percona Backup Locks


** (mydumper:28829): CRITICAL **: Couldn't acquire LOCK BINLOG FOR BACKUP, snapshots will not be consistent: You have an error in your SQL syntax; check the manual that corresponds to your MariaDB server version for the right syntax to use near 'BINLOG FOR BACKUP' at line 1

** Message: Started dump at: 2020-10-26 01:34:05


** Message: Written master status

** Message: Multisource slave detected.

** Message: Thread 5 connected using MySQL connection ID 64315

** Message: Thread 6 connected using MySQL connection ID 64345

** Message: Thread 7 connected using MySQL connection ID 64275

** Message: Thread 8 connected using MySQL connection ID 64283

** Message: Thread 1 connected using MySQL connection ID 64253

** Message: Thread 2 connected using MySQL connection ID 64211

** Message: Thread 3 connected using MySQL connection ID 64200

** Message: Thread 4 connected using MySQL connection ID 64211


** (mydumper:28829): CRITICAL **: Error: DB: mysql - Could not execute query: Access denied for user 'mysqldbadmin'@'%' to database 'mysql'

** Message: Thread 5 shutting down

** Message: Thread 6 shutting down

** Message: Thread 7 shutting down

** Message: Thread 8 shutting down

** Message: Thread 1 dumping data for `db1`.`TB1`

** Message: Thread 2 dumping data for `db1`.`tb2

….

As you can see, there's a limitation of taking backup from a managed database such as Azure. You might notice,

** (mydumper:28829): CRITICAL **: Couldn't acquire LOCK BINLOG FOR BACKUP, snapshots will not be consistent: You have an error in your SQL syntax; check the manual that corresponds to your MariaDB server version for the right syntax to use near 'BINLOG FOR BACKUP' at line 1

This is because, SUPER PRIVILEGE is not supported or restricted. Ideally, the best option to do this is to take the backup from a replica of your Azure Database. We'll talk about this later.

Now, at this point, mydumper will take a backup files in the form of *.gz files

  1. Load it to your destination on-premise server

$ myloader --host localhost --directory=$(pwd) --queries-per-transaction=10000 --threads=8 --compress-protocol --verbose=3

** Message: 8 threads created

** Message: Creating database `maximusdb`

** Message: Creating table `maximusdb`.`usertbl`

** Message: Creating table `maximusdb`.`familytbl`

** Message: Creating table `db2`.`t1`

** Message: Creating table `db3`.`test1`

…

….
  1. Setup the destination node as a slave/replica. mydumper will include a file called metadata which consists of binary log coordinates including GTID positions, for example:                                                                                                                                                                         

$ cat metadata

Started dump at: 2020-10-26 01:35:12

SHOW MASTER STATUS:

        Log: mysql-bin.000007

        Pos: 801

        GTID:0-3649485694-1705


Finished dump at: 2020-10-26 01:37:12

## Then run a change master from the replica or your target destination MySQL/MariaDB database node

CHANGE MASTER TO MASTER_HOST='<YOUR_AZURE_DB_HOSTNAME>', MASTER_LOG_FILE='mysql-bin.000007', MASTER_LOG_POS=801, MASTER_USER='repl_user', MASTER_PASSWORD='repl_passw0rd';

## Start the slave

START SLAVE;

At this point, you have now replicated from an Azure Database instance running MySQL/MariaDB. Once your application is ready to move away from your Azure Database instance, setup the endpoint going to your on-prem server and all remaining transactions from your Azure instance will be replicated to your on-prem leaving no data being missed going to your on-prem server.

Handling Limitations With Managed Databases For MySQL or MariaDB in Azure

Dealing with limitations especially when taking a backup dump of your dataset has to be 100% accurate from the point in time you have taken the backup dump. Of course, this is an ideal migration going to your on-prem. In order to deal with this, the best architecture setup is to have a replication topology presence in your Azure Database.

Once you have it and ready for migration, the mysqldump/mysqlpump or mydumper has to use the Azure Database replica as its source. Within that Azure Database replica, make sure that the SQL_THREAD is stopped so that you can snapshot or record the correctMASTER_LOG_FILE and EXEC_MASTER_LOG_POS from the result of SHOW SLAVE STATUS

Of course, once the backup has been done, do not forget to start your Azure Database replica to start its replication threads again.

Check For Data Discrepancies

Once you have your data loaded or dumped to your on-prem server acting as a replica from the Azure Database instance, you should double check this by running checksum calculations to determine how far your data is against the source Azure Database. We suggest you use pt-table-checksum tool from Percona Toolkit, but you can create your own though by using checksumming tools such as md5 or sha256 but this takes time to do. Additionally, using pt-upgrade from Percona Toolkit can help as well after your data migration using this replication approach is done.

Conclusion

Limitations of privileges and unsupported types from Azure Database can be challenging but with the appropriate flow and architecture, it's not impossible to migrate from a fully-managed database going on-prem. All you need to do is prepare the required steps, setup the required topology from your Azure Database source, then start migration from taking backups, to replication, and total migration to your on-prem.

Using the Percona Audit Log Plugin for Database Security

$
0
0

Why Do You Need To Use an Audit Plugin For Your Database?

Auditing in a database doesn't deviate from its meaning as it shares the same connotation i.e. to inspect, examine, and evaluate for such database events/transactions that are being logged or performed within your database. It in fact adds more feasibility for databases especially as a security feature, as it commends the administrative side to be sensitive for managing and processing data. It embraces the responsibility and accountability for data management.

Database Audit requires that for every transactions (i.e. DDLs and DMLs) has to be logged so as to record traces and get the full overview of what is happening during database operations. These operations can take the considerations:

  • Provides capability to monitor and debug so as to increase performance on the application side
  • Security and data privacy compliance such as PCI DSS, HIPAA, GDPR, etc. 
  • Provides capability to take data autonomy specific to multi-tenancy environments. This allows them to take data analysis so as to differentiate and filter transactions based on the sensitivity and privacy for security and performance considerations.
  • Drives administrative actions to prevent database users from inappropriate actions based on investigative suspicious activity or limited by its role. This means, read users, for example, shall only be allowed to pull data and only limited access to specific databases that they are only responsible for or with limited scope in accordance to their job role.

What is the Percona Audit Log Plugin?

Previous approaches on auditing transactions or events running in your database can be a hefty approach. Enabling general log file or either using slow query log. It's not a perfect approach so the audit log plugin manages to add more flexibility and customizable parameters to fill up the gap. Percona claims their Audit Log Plugin is an alternative to MySQL Enterprise Audit. Although that is true, there's a caveat here that Percona's Audit Log Plugin is not available for Oracle's MySQL for installation. There's no downloadable tarball for this binary but it is easy to install by just copying an existing audit_log.so file from an existing Percona Server or Percona XtraDB Cluster installation. Best to recommend to use or copy an existing audit_log.so of the same version of Percona Server with the MySQL community version as well. So if your target MySQL Community version is of 8.x, then use the audit_log.so from a Percona Server 8.x version as well. We will show you how to do this on a MySQL community version later on this blog.

The Percona Audit Log Plugin is of course open-source and it is available for free of use. So if your enterprise application uses a backend database such as Percona Server or the vanilla MySQL, then you can use this plugin. MySQL Enterprise Audit is only available for MySQL Enterprise Server and that comes with a price. Additionally, Percona is constantly updating and maintaining this software and this comes as a major advantage as if any major release from the MySQL upstream is available. Percona will also release based on its major version and that affects updates and tested functionality as well for their audit log plugin tool. So any incompatibility from its previous versions, shall be updated as well to work with the most recent and secure version of MySQL.

The Percona Audit Log Plugin is tagged as one of a security tool but let us clarify this again. This tool is used for auditing logs. It's sole purpose is to log traces of transactions from your database. It does not do firewalling nor it does not apply preventive measures to block specific users. This tool is mainly for auditing logs and use for database transaction analysis.

Using The Percona Audit Log Plugin

In this section, we'll go over on how to install, use, and how beneficial the plugin can be especially in real-world situations.

Installing The Plugin

Percona comes with various sources for their database binaries. Once you install the database server properly, the standard installation will place the audit log plugin shared-object in  /usr/lib64/mysql/plugin/audit_log.so. Installing the plugin as a way to enable it within the Percona/MySQL server can be done with the following actions below. This steps is done using Percona Server 8.0,

mysql> select @@version_comment, @@version\G

*************************** 1. row ***************************

@@version_comment: Percona Server (GPL), Release 12, Revision 7ddfdfe

        @@version: 8.0.21-12

1 row in set (0.00 sec)

Then the steps are as follows:

  1. Verify first if the plugin exists or not

## Check if the plugin is enabled or installed

mysql> select * from information_schema.PLUGINS where PLUGIN_NAME like '%audit%';

Empty set (0.00 sec)


mysql> show variables like 'audit%';

Empty set (0.00 sec)
  1. Install the plugin,

## Check where are the plugins located

mysql> show variables like 'plugin%';

+---------------+--------------------------+

| Variable_name | Value                    |

+---------------+--------------------------+

| plugin_dir    | /usr/lib64/mysql/plugin/ |

+---------------+--------------------------+

1 row in set (0.00 sec)


mysql> \! ls -a /usr/lib64/mysql/plugin/audit_log.so

/usr/lib64/mysql/plugin/audit_log.so

## Ready and then install

mysql> INSTALL PLUGIN audit_log SONAME 'audit_log.so';

Query OK, 0 rows affected (0.01 sec)
  1. Verify it back once again

mysql> select * from information_schema.PLUGINS where PLUGIN_NAME like '%audit%'\G

*************************** 1. row ***************************

           PLUGIN_NAME: audit_log

        PLUGIN_VERSION: 0.2

         PLUGIN_STATUS: ACTIVE

           PLUGIN_TYPE: AUDIT

   PLUGIN_TYPE_VERSION: 4.1

        PLUGIN_LIBRARY: audit_log.so

PLUGIN_LIBRARY_VERSION: 1.10

         PLUGIN_AUTHOR: Percona LLC and/or its affiliates.

    PLUGIN_DESCRIPTION: Audit log

        PLUGIN_LICENSE: GPL

           LOAD_OPTION: ON

1 row in set (0.00 sec)


mysql> show variables like 'audit%';

+-----------------------------+---------------+

| Variable_name               | Value         |

+-----------------------------+---------------+

| audit_log_buffer_size       | 1048576       |

| audit_log_exclude_accounts  |               |

| audit_log_exclude_commands  |               |

| audit_log_exclude_databases |               |

| audit_log_file              | audit.log     |

| audit_log_flush             | OFF           |

| audit_log_format            | OLD           |

| audit_log_handler           | FILE          |

| audit_log_include_accounts  |               |

| audit_log_include_commands  |               |

| audit_log_include_databases |               |

| audit_log_policy            | ALL           |

| audit_log_rotate_on_size    | 0             |

| audit_log_rotations         | 0             |

| audit_log_strategy          | ASYNCHRONOUS  |

| audit_log_syslog_facility   | LOG_USER      |

| audit_log_syslog_ident      | percona-audit |

| audit_log_syslog_priority   | LOG_INFO      |

+-----------------------------+---------------+

18 rows in set (0.00 sec)

Installing the Percona Audit Plugin Over the MySQL Community Version

When installing on Oracle MySQL versions, as what we have mentioned above, always match with the version of Percona Server where the audit_log.so file came from. So for example, I have the following versions of MySQL below,

nodeB $  mysqld --version

/usr/sbin/mysqld  Ver 8.0.22 for Linux on x86_64 (MySQL Community Server - GPL)

Whereas, my Percona Server is,

nodeA $ mysqld --version

/usr/sbin/mysqld  Ver 8.0.21-12 for Linux on x86_64 (Percona Server (GPL), Release 12, Revision 7ddfdfe)

All you need to do is copy from the Percona source to the server where you have MySQL Community Server installed.

nodeA $ scp /usr/lib64/mysql/plugin/audit_log.so nodeB:/tmp/

Then move to /usr/lib64/mysql/plugin for which plugins shall be located.

root@nodeB > show global variables like 'plugin%';

+---------------+--------------------------+

| Variable_name | Value                    |

+---------------+--------------------------+

| plugin_dir    | /usr/lib64/mysql/plugin/ |

+---------------+--------------------------+

1 row in set (0.00 sec)


nodeB $ mv /tmp/audit_log.so /usr/lib64/mysql/plugin

All the rest, you can follow the steps as stated above to continue installing or enabling the Percona Audit Login Plugin for MySQL Community Server.

Configuration and Managing Percona Audit Log Plugin

Percona Audit Log Plugin is a very flexible tool that is very configurable or customizable to cater your requirements as you log your database connections or transactions. It's a linear fashion implementation for its given configuration so even if it's flexible to be customized by its given parameters, only those given values shall be logged and audited during the whole time your database runs and it's done asynchronously by default.  Every parameter variables in this plugin are important but below are the most important parameters that you can use to configure the plugin:

  • audit_log_strategy- Used to specify the audit log strategy and when audit_log_handler is set to FILE. which is either the following values are possible: 
    • ASYNCHRONOUS - (default) log using memory buffer, do not drop messages if buffer is full
    • PERFORMANCE - log using memory buffer, drop messages if buffer is full
    • SEMISYNCHRONOUS - log directly to file, do not flush and sync every event
    • SYNCHRONOUS - log directly to file, flush and sync every event
  • audit_log_file- Filename to be used to store audit logs, which defaults to file ${datadir}/audit.log. You can use relative file path from the datadir of your database or the absolute file path.
  • audit_log_flush- Useful when you need to flush the log such as being used in coordination with logrotate
  • audit_log_buffer_size- By default, Percona Audit Log records traces to the default file log. This variable is useful when audit_log_handler = FILE, and audit_log_strategy = ASYNCHRONOUS or PERFORMANCE.  When set, it is used to specify the size of the memory buffer used for logging. This allows you to avoid performance penalty degradation when auditing logs is enabled.
  • audit_log_format- Format to specify when recording or saving information to your audit log file. Accepts formats as OLD/NEW (based on XML format), JSON, and CSV. This is very useful especially when you incorporate later with other external tools to pull your audit logs that support specific formats.
  • audit_log_exclude_accounts/audit_log_include_accounts - Used to specify the list of users you can include or exclude respective to its param name. Accepts NULL otherwise a comma separated list in the format of user@host or 'user'@'host'. These variables are mutually exclusive so it has to be unset (i.e. value is NULL) one or the other
  • audit_log_include_commands/audit_log_exclude_commands  - Used to specify the list of commands (either NULL or comma separated list) for which filtering by SQL command type is applied. These variables are mutually exclusive so it has to be unset (i.e. value is NULL) one or the other. To get the list of SQL command types in MySQL or Percona, do the following:
    • enable performance_schema=ON variable in your my.cnf (requires database server restart)
    • Run the following query: SELECT GROUP_CONCAT(SUBSTRING_INDEX(name, '/', -1) ORDER BY name) sql_statement FROM performance_schema.setup_instruments WHERE name LIKE "statement/sql/%"\G
  • audit_log_include_databases/audit_log_exclude_databases - used to specify to filter by database name and with conjunction to audit_log_{include,exclude}_commands to filter the list of commands so as to be more granular when logging during auditing logs. These variables are mutually exclusive so it has to be unset (i.e. value is NULL) one or the other.
  • audit_log_policy- Used to specify which events should be logged. Technically, you can set this variable dynamically to enable or disable (set value to NONE) for your audit logging. Possible values are:
    • ALL - all events will be logged
    • LOGINS - only logins will be logged
    • QUERIES - only queries will be logged
    • NONE - no events will be logged

Managing the Audit Log Plugin

As mentioned, default log file goes to ${data_dir}/audit.log and uses XML format just like my example below:

[root@testnode20 ~]# ls /var/lib/mysql/audit.log  | xargs tail -28

<AUDIT_RECORD

  NAME="Ping"

  RECORD="28692714_2020-10-28T19:12:18"

  TIMESTAMP="2020-10-29T09:39:56Z"

  COMMAND_CLASS="error"

  CONNECTION_ID="10"

  STATUS="0"

  SQLTEXT=""

  USER="cmon[cmon] @  [192.168.10.200]"

  HOST=""

  OS_USER=""

  IP="192.168.10.200"

  DB="information_schema"

/>

<AUDIT_RECORD

  NAME="Query"

  RECORD="28692715_2020-10-28T19:12:18"

  TIMESTAMP="2020-10-29T09:39:56Z"

  COMMAND_CLASS="show_status"

  CONNECTION_ID="10"

  STATUS="0"

  SQLTEXT="SHOW GLOBAL STATUS"

  USER="cmon[cmon] @  [192.168.10.200]"

  HOST=""

  OS_USER=""

  IP="192.168.10.200"

  DB="information_schema"

/>

Now, let's manage the Percona Audit Log Plugin in a real case scenario. Inspired by the work of Dani's blog of Percona, let's consider changing the following variables in my.cnf,

[root@testnode20 ~]# grep -i 'audit' /etc/my.cnf

## Audit Log

audit_log_format=JSON

audit_log_strategy=PERFORMANCE

audit_log_policy=QUERIES

audit_log_exclude_databases=s9s

Then let's create the following database and tables,

CREATE DATABASE s9s;

CREATE TABLE `audit_records` ( `id` int unsigned NOT NULL AUTO_INCREMENT,  `audit_record` json,   PRIMARY KEY (`id`) ) ENGINE=InnoDB;

Then let's use A named pipe or FIFO in Linux to collect logs ready for auditing but which we can later use feasibly. 

$ mkfifo /tmp/s9s_fifo

$ exec 1<>/tmp/s9s_fifo

$ tail -f /var/lib/mysql/audit.log 1>/tmp/s9s_fifo 2>&1

Then, let's insert any logs to our table `s9s`.`audit_records` using the following script below,

#/bin/bash

pipe=/tmp/s9s_fifo

while true; do

    if read line <$pipe; then 

if [[ "$line" == 'quit' ]]; then 

break

fi 

mysql --show-warnings -vvv -e "INSERT INTO s9s.audit_records (audit_record) VALUES(\"${line//\"/\\\"}\")" 

    fi

done

Then I did try running a benchmark using sysbench. Now, with the following entries I have,

mysql> select count(1) from audit_records\G

*************************** 1. row ***************************

count(1): 37856

1 row in set (0.11 sec)

I can do some auditing using JSON which is making it feasible for me to do auditing and investigation or even performance analysis of my database. For example,

mysql> SELECT top10_select_insert from ((select audit_record->"$.audit_record" as top10_select_insert from audit_records  where audit_record->"$.audit_record.command_class" in ('select') order by audit_records.id desc limit 10) union all (select audit_record->"$.audit_record" as top10_select_insert from audit_records  where audit_record->"$.audit_record.command_class" in ('insert')  order by audit_records.id desc limit 10)) AS b\G

*************************** 1. row ***************************

top10_select_insert: {"db": "sbtest", "ip": "192.168.10.200", "host": "", "name": "Query", "user": "cmon[cmon] @  [192.168.10.200]", "record": "326263176_2020-10-29T10:35:07", "status": 0, "os_user": "", "sqltext": "SELECT DISTINCT c FROM sbtest1 WHERE id BETWEEN 5001 AND 5100 ORDER BY c", "timestamp": "2020-10-29T11:11:56Z", "command_class": "select", "connection_id": "25143"}

*************************** 2. row ***************************

top10_select_insert: {"db": "sbtest", "ip": "192.168.10.200", "host": "", "name": "Query", "user": "cmon[cmon] @  [192.168.10.200]", "record": "326263175_2020-10-29T10:35:07", "status": 0, "os_user": "", "sqltext": "SELECT c FROM sbtest4 WHERE id BETWEEN 4875 AND 4974 ORDER BY c", "timestamp": "2020-10-29T11:11:56Z", "command_class": "select", "connection_id": "25143"}

*************************** 3. row ***************************

top10_select_insert: {"db": "sbtest", "ip": "192.168.10.200", "host": "", "name": "Query", "user": "cmon[cmon] @  [192.168.10.200]", "record": "326263174_2020-10-29T10:35:07", "status": 0, "os_user": "", "sqltext": "SELECT SUM(k) FROM sbtest1 WHERE id BETWEEN 5017 AND 5116", "timestamp": "2020-10-29T11:11:56Z", "command_class": "select", "connection_id": "25143"}

*************************** 4. row ***************************

top10_select_insert: {"db": "sbtest", "ip": "192.168.10.200", "host": "", "name": "Query", "user": "cmon[cmon] @  [192.168.10.200]", "record": "326263173_2020-10-29T10:35:07", "status": 0, "os_user": "", "sqltext": "SELECT c FROM sbtest8 WHERE id BETWEEN 4994 AND 5093", "timestamp": "2020-10-29T11:11:56Z", "command_class": "select", "connection_id": "25153"}

*************************** 5. row ***************************

top10_select_insert: {"db": "sbtest", "ip": "192.168.10.200", "host": "", "name": "Query", "user": "cmon[cmon] @  [192.168.10.200]", "record": "326263172_2020-10-29T10:35:07", "status": 0, "os_user": "", "sqltext": "SELECT c FROM sbtest3 WHERE id=4976", "timestamp": "2020-10-29T11:11:56Z", "command_class": "select", "connection_id": "25153"}

*************************** 6. row ***************************

top10_select_insert: {"db": "sbtest", "ip": "192.168.10.200", "host": "", "name": "Query", "user": "cmon[cmon] @  [192.168.10.200]", "record": "326263171_2020-10-29T10:35:07", "status": 0, "os_user": "", "sqltext": "SELECT c FROM sbtest3 WHERE id=5018", "timestamp": "2020-10-29T11:11:56Z", "command_class": "select", "connection_id": "25153"}

*************************** 7. row ***************************

top10_select_insert: {"db": "sbtest", "ip": "192.168.10.200", "host": "", "name": "Query", "user": "cmon[cmon] @  [192.168.10.200]", "record": "326263170_2020-10-29T10:35:07", "status": 0, "os_user": "", "sqltext": "SELECT c FROM sbtest3 WHERE id=5026", "timestamp": "2020-10-29T11:11:56Z", "command_class": "select", "connection_id": "25153"}

*************************** 8. row ***************************

top10_select_insert: {"db": "sbtest", "ip": "192.168.10.200", "host": "", "name": "Query", "user": "cmon[cmon] @  [192.168.10.200]", "record": "326263169_2020-10-29T10:35:07", "status": 0, "os_user": "", "sqltext": "SELECT c FROM sbtest3 WHERE id=5711", "timestamp": "2020-10-29T11:11:56Z", "command_class": "select", "connection_id": "25153"}

*************************** 9. row ***************************

top10_select_insert: {"db": "sbtest", "ip": "192.168.10.200", "host": "", "name": "Query", "user": "cmon[cmon] @  [192.168.10.200]", "record": "326263168_2020-10-29T10:35:07", "status": 0, "os_user": "", "sqltext": "SELECT c FROM sbtest3 WHERE id=5044", "timestamp": "2020-10-29T11:11:56Z", "command_class": "select", "connection_id": "25153"}

*************************** 10. row ***************************

top10_select_insert: {"db": "sbtest", "ip": "192.168.10.200", "host": "", "name": "Query", "user": "cmon[cmon] @  [192.168.10.200]", "record": "326263167_2020-10-29T10:35:07", "status": 0, "os_user": "", "sqltext": "SELECT c FROM sbtest3 WHERE id=5637", "timestamp": "2020-10-29T11:11:56Z", "command_class": "select", "connection_id": "25153"}

*************************** 11. row ***************************

top10_select_insert: {"db": "sbtest", "ip": "192.168.10.200", "host": "", "name": "Query", "user": "cmon[cmon] @  [192.168.10.200]", "record": "326263151_2020-10-29T10:35:07", "status": 0, "os_user": "", "sqltext": "INSERT INTO sbtest9 (id, k, c, pad) VALUES (4998, 4986, '02171032529-62046503057-07366460505-11685363597-46873502976-33077071866-44215205484-05994642442-06380315383-02875729800', '19260637605-33008876390-94789070914-09039113107-89863581488')", "timestamp": "2020-10-29T11:11:56Z", "command_class": "insert", "connection_id": "25124"}

*************************** 12. row ***************************

top10_select_insert: {"db": "sbtest", "ip": "192.168.10.200", "host": "", "name": "Query", "user": "cmon[cmon] @  [192.168.10.200]", "record": "326263133_2020-10-29T10:35:07", "status": 0, "os_user": "", "sqltext": "INSERT INTO sbtest8 (id, k, c, pad) VALUES (6081, 4150, '18974493622-09995560953-16579360264-35381241173-70425414992-87533708595-45025145447-98882906947-17081170077-49181742629', '20737943314-90440646708-38143024644-95915967543-47972430163')", "timestamp": "2020-10-29T11:11:56Z", "command_class": "insert", "connection_id": "25133"}

*************************** 13. row ***************************

top10_select_insert: {"db": "sbtest", "ip": "192.168.10.200", "host": "", "name": "Query", "user": "cmon[cmon] @  [192.168.10.200]", "record": "326263126_2020-10-29T10:35:07", "status": 0, "os_user": "", "sqltext": "INSERT INTO sbtest2 (id, k, c, pad) VALUES (5014, 5049, '82143477938-07198858971-84944276583-28705099377-04269543238-74209284999-24766869883-70274359968-19384709611-56871076616', '89380034594-52170436945-89656244047-48644464580-26885108397')", "timestamp": "2020-10-29T11:11:56Z", "command_class": "insert", "connection_id": "25135"}

*************************** 14. row ***************************

top10_select_insert: {"db": "sbtest", "ip": "192.168.10.200", "host": "", "name": "Query", "user": "cmon[cmon] @  [192.168.10.200]", "record": "326263119_2020-10-29T10:35:07", "status": 0, "os_user": "", "sqltext": "INSERT INTO sbtest5 (id, k, c, pad) VALUES (4995, 3860, '07500343929-19373180618-48491497019-86674883771-87861925606-04683804124-03278606074-05397614513-84175620410-77007118978', '19374966620-11798221232-19991603086-34443959669-69834306417')", "timestamp": "2020-10-29T11:11:56Z", "command_class": "insert", "connection_id": "25142"}

*************************** 15. row ***************************

top10_select_insert: {"db": "sbtest", "ip": "192.168.10.200", "host": "", "name": "Query", "user": "cmon[cmon] @  [192.168.10.200]", "record": "326263112_2020-10-29T10:35:07", "status": 0, "os_user": "", "sqltext": "INSERT INTO sbtest10 (id, k, c, pad) VALUES (5766, 5007, '46189905191-42872108894-20541866044-43286474408-49735155060-20388245380-67571749662-72179825415-56363344183-47524887111', '24559469844-22477386116-04417716308-05721823869-32876821172')", "timestamp": "2020-10-29T11:11:56Z", "command_class": "insert", "connection_id": "25137"}

*************************** 16. row ***************************

top10_select_insert: {"db": "sbtest", "ip": "192.168.10.200", "host": "", "name": "Query", "user": "cmon[cmon] @  [192.168.10.200]", "record": "326263083_2020-10-29T10:35:07", "status": 0, "os_user": "", "sqltext": "INSERT INTO sbtest7 (id, k, c, pad) VALUES (5033, 4986, '20695843208-59656863439-60406010814-11793724813-45659184103-02803540858-01466094684-30557262345-15801610791-28290093674', '14178983572-33857930891-42382490524-21373835727-23623125230')", "timestamp": "2020-10-29T11:11:56Z", "command_class": "insert", "connection_id": "25118"}

*************************** 17. row ***************************

top10_select_insert: {"db": "sbtest", "ip": "192.168.10.200", "host": "", "name": "Query", "user": "cmon[cmon] @  [192.168.10.200]", "record": "326263076_2020-10-29T10:35:07", "status": 0, "os_user": "", "sqltext": "INSERT INTO sbtest1 (id, k, c, pad) VALUES (5029, 5016, '72342762580-04669595160-76797241844-46205057564-77659988460-00393018079-89701448932-22439638942-02011990830-97695117676', '13179789120-16401633552-44237908265-34585805608-99910166472')", "timestamp": "2020-10-29T11:11:56Z", "command_class": "insert", "connection_id": "25121"}

*************************** 18. row ***************************

top10_select_insert: {"db": "sbtest", "ip": "192.168.10.200", "host": "", "name": "Query", "user": "cmon[cmon] @  [192.168.10.200]", "record": "326263036_2020-10-29T10:35:07", "status": 0, "os_user": "", "sqltext": "INSERT INTO sbtest1 (id, k, c, pad) VALUES (5038, 5146, '62239893938-24763792785-75786071570-64441378769-99060498468-07437802489-36899434285-44705822299-70849806976-77287283409', '03220277005-21146501539-10986216439-83162542410-04253248063')", "timestamp": "2020-10-29T11:11:55Z", "command_class": "insert", "connection_id": "25127"}

*************************** 19. row ***************************

top10_select_insert: {"db": "sbtest", "ip": "192.168.10.200", "host": "", "name": "Query", "user": "cmon[cmon] @  [192.168.10.200]", "record": "326263018_2020-10-29T10:35:07", "status": 0, "os_user": "", "sqltext": "INSERT INTO sbtest4 (id, k, c, pad) VALUES (5004, 5028, '15487433957-59189974170-83116468418-96078631606-58760747556-09307871236-40520753062-17596570189-73692856496-38267942694', '98937710805-24695902707-05013528796-18454393948-39118534483')", "timestamp": "2020-10-29T11:11:55Z", "command_class": "insert", "connection_id": "25129"}

*************************** 20. row ***************************

top10_select_insert: {"db": "sbtest", "ip": "192.168.10.200", "host": "", "name": "Query", "user": "cmon[cmon] @  [192.168.10.200]", "record": "326262989_2020-10-29T10:35:07", "status": 0, "os_user": "", "sqltext": "INSERT INTO sbtest3 (id, k, c, pad) VALUES (5015, 5030, '30613877119-41343977889-67711116708-96041306890-46480766663-68231747217-07404586739-83073703805-75534384550-12407169697', '65220283880-37505643788-94809192635-84679347406-74995175373')", "timestamp": "2020-10-29T11:11:55Z", "command_class": "insert", "connection_id": "25139"}

20 rows in set (0.00 sec)

Aggregate Your Audit Logs With Other Tools

Now that you are able to parse the output of your audit logs, you can start incorporating it to other external tools and start aggregating with your current environment or technology stack as long as it reads or supports JSON. For example, using ELK (Elasticsearch, Logstash Kibana) to parse and centralize your logs. You might also try to incorporate with Graylog or Fluentd. On the other hand, you might create your own viewer and incorporate with your current software setup. Using Percona Audit Log makes these things feasible to do more analysis with high productivity and of course feasible and extensible as well.
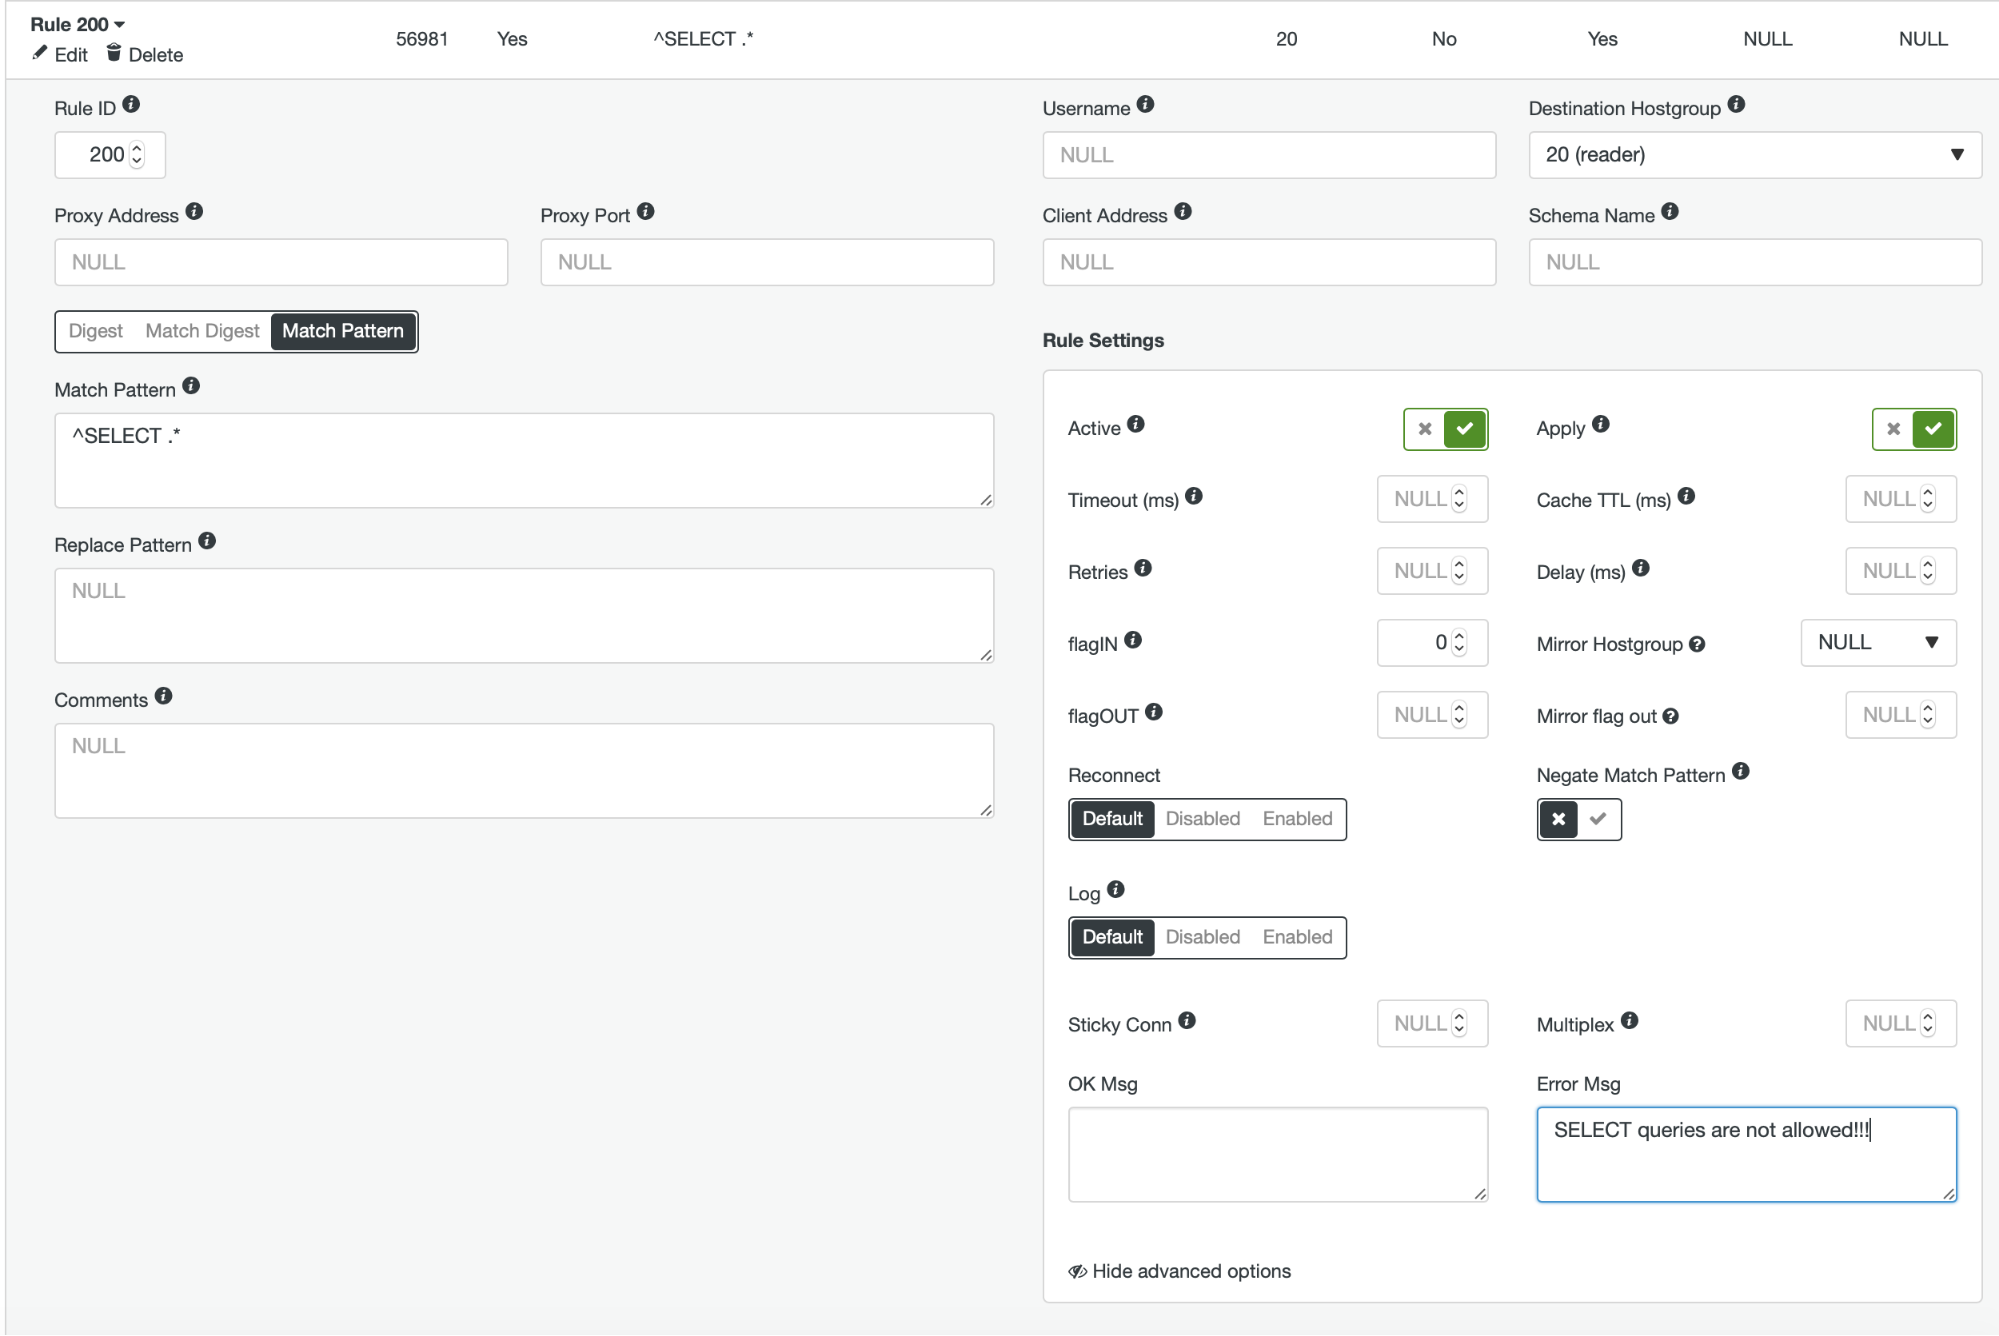
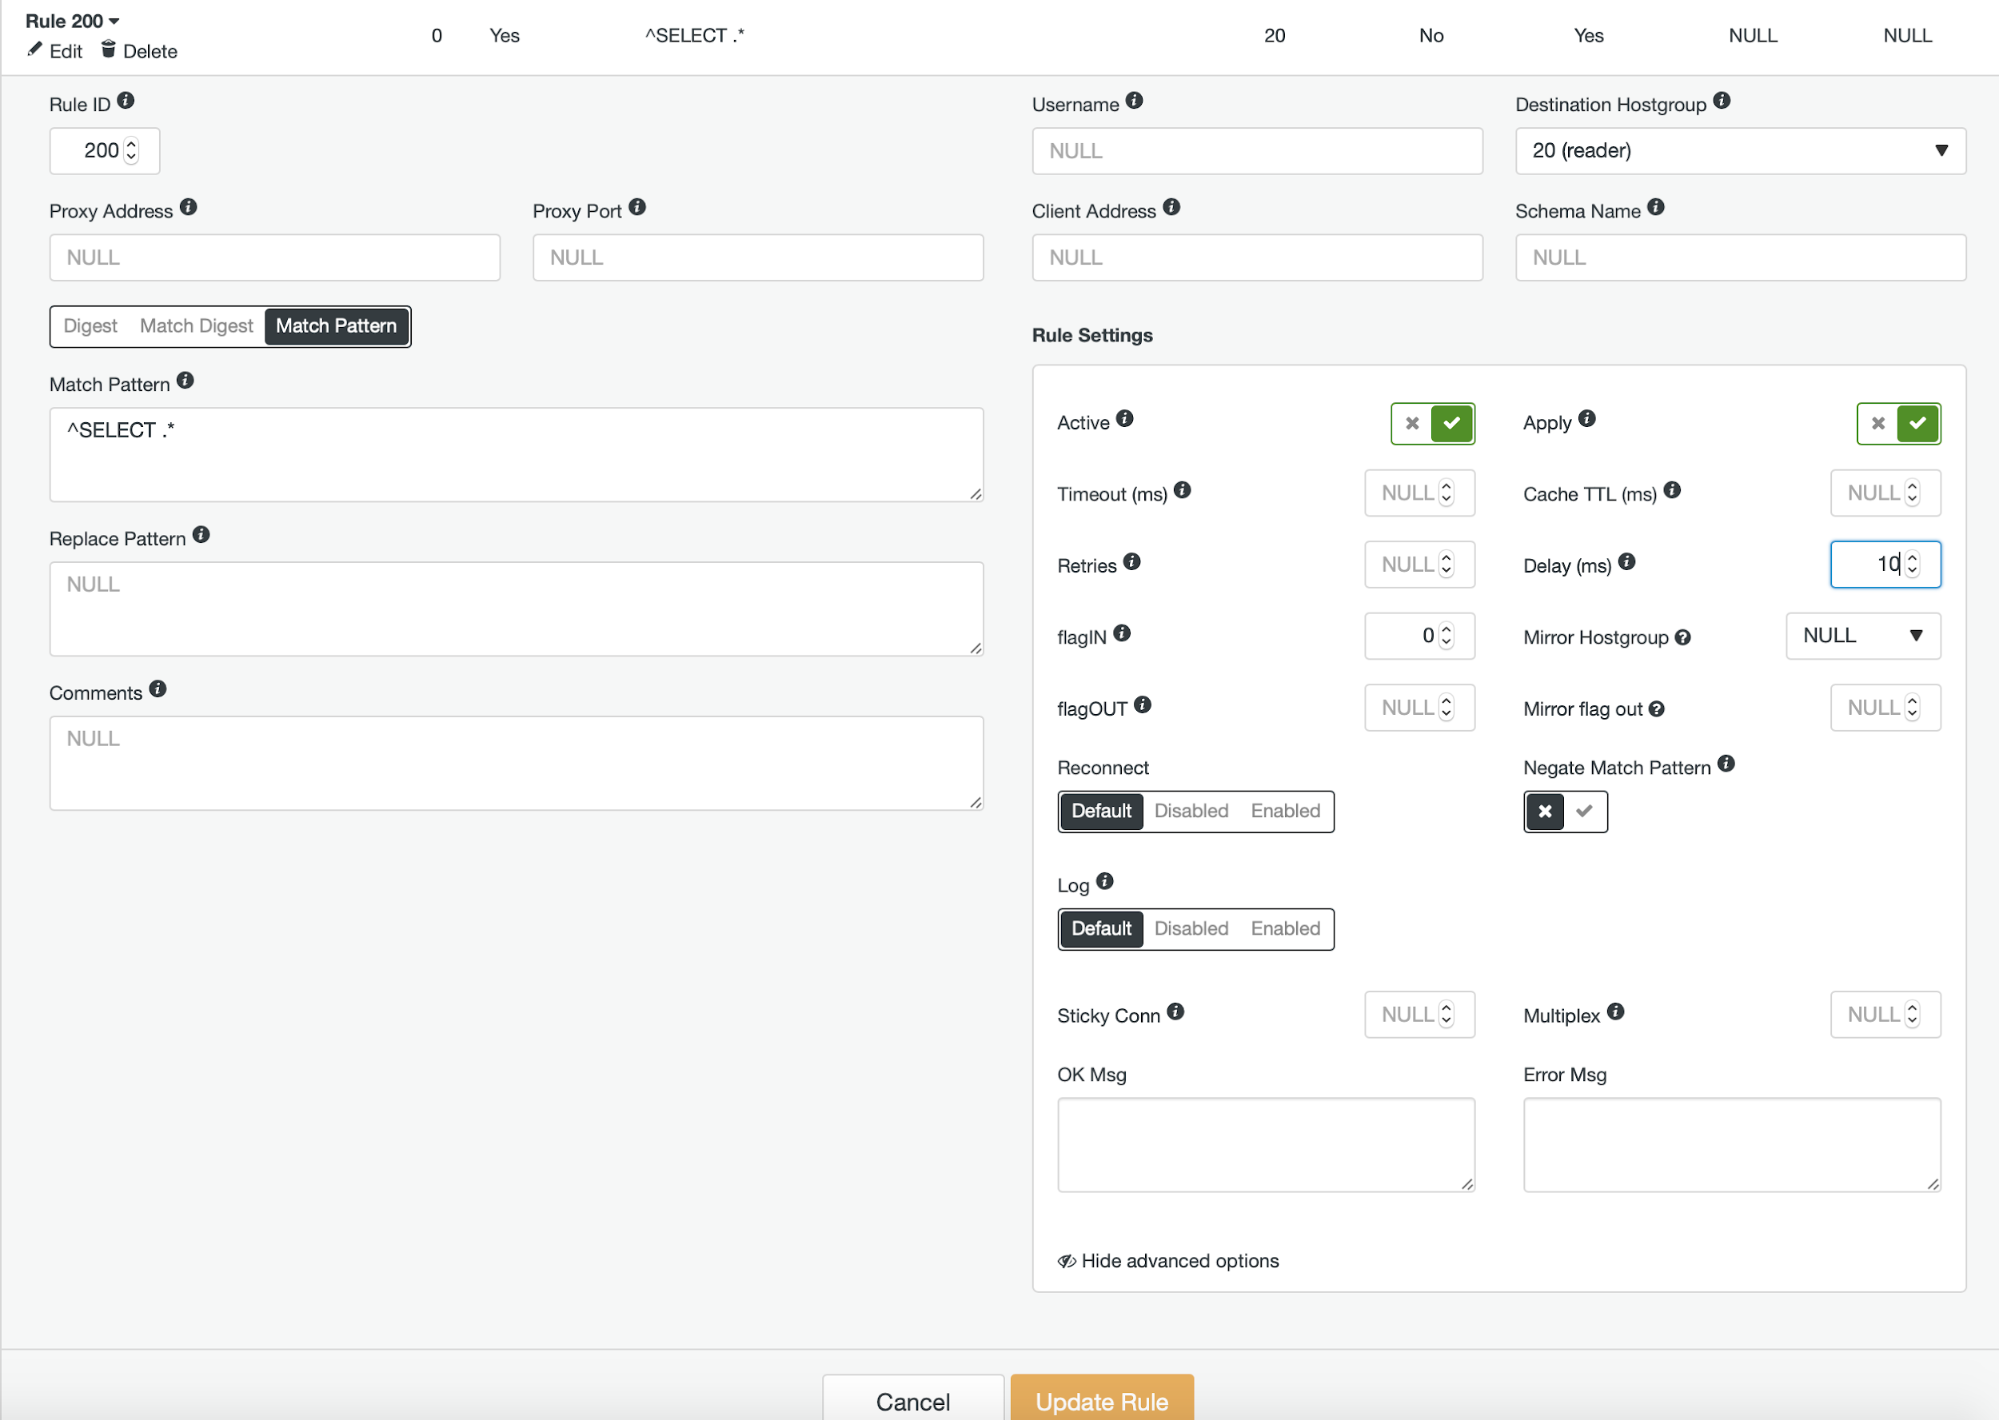
An Overview of the Percona XtraDB Cluster Kubernetes Operator

$
0
0

If you have been around in the container world, you would know that it is pretty challenging to adopt a full Kubernetes automation for a clustered database system, which commonly adds a level of complexity to the container-based architecture for these stateful applications. That's where a Kubernetes Operator can help us to address this problem. A Kubernetes Operator is a special type of controller introduced to simplify complex deployments which basically extends the Kubernetes API with custom resources. It builds upon the basic Kubernetes resource and controller concepts but includes domain or application-specific knowledge to automate the entire life cycle of the software it manages.

Percona XtraDB Cluster Operator is a neat way to automate the specific tasks of Percona XtraDB Cluster like deployment, scaling, backups and upgrades within Kubernetes, built and maintained by Percona. It deploys the cluster in a StatefulSet with a Persistent Volume, which allows us to maintain a consistent identity for each Pod in the cluster and our data to be maintained. 

In this blog post, we are going to test out the deployment of Percona XtraDB Cluster 8.0 in a containerized environment, orchestrated by Percona XtraDB Cluster Kubernetes Operator on Google Cloud Platform. 

Creating a Kubernetes Cluster on Google Cloud

In this walkthrough, we are going to use the Kubernetes cluster on Google Cloud because it is relatively simple and easy to get Kubernetes up and running. Login to your Google Cloud Platform dashboard -> Compute -> Kubernetes Engine -> Create Cluster, and you will be presented with the following dialog:

Just enter the Kubernetes Cluster name, pick your preferred zone and click "CREATE" (at the bottom of the page). In 5 minutes, a 3-node Kubernetes cluster will be ready. Now, on your workstation, install the gcloud SDK as shown in this guide and then pull the Kubernetes configuration into your workstation:

$ gcloud container clusters get-credentials my-k8s-cluster --zone asia-northeast1-a --project s9s-qa
Fetching cluster endpoint and auth data.
kubeconfig entry generated for my-k8s-cluster.

You should be able to connect to the Kubernetes cluster at this point. Run the following command to verify:

$ kubectl get nodes
NAME                                            STATUS   ROLES    AGE    VERSION
gke-my-k8s-cluster-default-pool-b80902cd-gp09   Ready    <none>   139m   v1.16.13-gke.401
gke-my-k8s-cluster-default-pool-b80902cd-jdc3   Ready    <none>   139m   v1.16.13-gke.401
gke-my-k8s-cluster-default-pool-b80902cd-rdv8   Ready    <none>   139m   v1.16.13-gke.401

The above output means that we are able to connect to the Kubernetes master and retrieve the Kubernetes cluster nodes. Now, we are ready to run the Kubernetes workloads. 

Deploying a Percona XtraDB Cluster on Kubernetes

For workload deployment, we are going to follow the instructions as stated in the Percona XtraDB Cluster Operator documentation. Basically, we run the following command on our workstation to create the custom resources, namespace, role-based access control and also the Kubernetes operator itself:

$ git clone -b v1.6.0 https://github.com/percona/percona-xtradb-cluster-operator
$ cd percona-xtradb-cluster-operator/
$ kubectl apply -f deploy/crd.yaml
$ kubectl create namespace pxc
$ kubectl config set-context $(kubectl config current-context) --namespace=pxc
$ kubectl create clusterrolebinding cluster-admin-binding --clusterrole=cluster-admin --user=$(gcloud config get-value core/account)
$ kubectl apply -f deploy/rbac.yaml
$ kubectl apply -f deploy/operator.yaml

Next, we have to prepare our passwords (it's called Secrets in Kubernetes term) by updating the values inside deploy/secrets.yaml in a base64 encoded format. You can use online tools like https://www.base64encode.org/ to create one or using a command-line tool like the following:

$ echo -n 'mypassword' | base64
bXlwYXNzd29yZA==

Then, update the deploy/secrets.yaml, as shown below:

apiVersion: v1
kind: Secret
metadata:
  name: my-cluster-secrets
type: Opaque
data:
  root: bXlwYXNzd29yZA==
  xtrabackup: bXlwYXNzd29yZA==
  monitor: bXlwYXNzd29yZA==
  clustercheck: bXlwYXNzd29yZA==
  proxyadmin: bXlwYXNzd29yZA==
  pmmserver: bXlwYXNzd29yZA==
  operator: bXlwYXNzd29yZA==

The above is a super simplification of secret management, where we set all passwords to be the same for all users. In production, please use a more complex password and specify a different password for every user. 

Now, we can push the secret configuration to Kubernetes:

$ kubectl apply -f deploy/secrets.yaml

Before we move forward to deploy a Percona XtraDB Cluster, we need to revisit the default deployment definition inside deploy/cr.yaml for the cluster. There are a lot of Kubernetes objects that are defined here but most of them are commented out. For our workload, we would make the modification as below:

$ cat deploy/cr.yaml
apiVersion: pxc.percona.com/v1-6-0
kind: PerconaXtraDBCluster
metadata:
  name: cluster1
  finalizers:
    - delete-pxc-pods-in-order
spec:
  crVersion: 1.6.0
  secretsName: my-cluster-secrets
  vaultSecretName: keyring-secret-vault
  sslSecretName: my-cluster-ssl
  sslInternalSecretName: my-cluster-ssl-internal
  allowUnsafeConfigurations: false
  updateStrategy: SmartUpdate
  upgradeOptions:
    versionServiceEndpoint: https://check.percona.com
    apply: recommended
    schedule: "0 4 * * *"
  pxc:
    size: 3
    image: percona/percona-xtradb-cluster:8.0.20-11.1
    configuration: |
      [client]
      default-character-set=utf8

      [mysql]
      default-character-set=utf8

      [mysqld]
      collation-server = utf8_unicode_ci
      character-set-server = utf8
      default_authentication_plugin = mysql_native_password
    resources:
      requests:
        memory: 1G
    affinity:
      antiAffinityTopologyKey: "kubernetes.io/hostname"
    podDisruptionBudget:
      maxUnavailable: 1
    volumeSpec:
      persistentVolumeClaim:
        resources:
          requests:
            storage: 6Gi
    gracePeriod: 600
  haproxy:
    enabled: true
    size: 3
    image: percona/percona-xtradb-cluster-operator:1.6.0-haproxy
    resources:
      requests:
        memory: 1G
    affinity:
      antiAffinityTopologyKey: "kubernetes.io/hostname"
    podDisruptionBudget:
      maxUnavailable: 1
    gracePeriod: 30
  backup:
    image: percona/percona-xtradb-cluster-operator:1.6.0-pxc8.0-backup
    storages:
      fs-pvc:
        type: filesystem
        volume:
          persistentVolumeClaim:
            accessModes: [ "ReadWriteOnce" ]
            resources:
              requests:
                storage: 6Gi
    schedule:
      - name: "daily-backup"
        schedule: "0 0 * * *"
        keep: 5
        storageName: fs-pvc

We have made some modifications to the provided cr.yaml to make it work with our application, as shown above. First of all, we have to comment out (or remove) all CPU related lines, for example [*].resources.requests.cpu: 600m, to make sure Kubernetes is able to schedule the pod creation correctly on nodes with limited CPU. Then we need to add some compatibility options for Percona XtraDB Cluster 8.0 which is based on MySQL 8.0, to work smoothly with our WordPress application that we are going to deploy later on, as shown in the following excerpt:

   configuration: |
      [client]
      default-character-set=utf8

      [mysql]
      default-character-set=utf8

      [mysqld]
      collation-server = utf8_unicode_ci
      character-set-server = utf8
      default_authentication_plugin = mysql_native_password

The above will match the MySQL server's default character set with the MySQLi PHP driver in our WordPress container. The next section is the HAProxy deployment where it is set to "enabled: true". There is also a ProxySQL section with "enabled: false" - commonly one would pick either of the reverse proxies for every cluster. The last section is the backup configuration, where we would like to have a daily backup scheduled at 12:00 AM every day and keep that last 5 backups.

We can now start to deploy our 3-node Percona XtraDB Cluster:

$ kubectl apply -f deploy/cr.yaml

The creation process will take some time. The operator will deploy the Percona XtraDB Cluster pods as a Stateful Set, which means one pod creation at a time and each Pod in the StatefulSet will be assigned an integer ordinal, from 0 up through N-1, that is unique over the set. The process is over when both operator and the Pods have reached their Running status:

$ kubectl get pods
NAME                                               READY   STATUS    RESTARTS   AGE
cluster1-haproxy-0                                 2/2     Running   0          71m
cluster1-haproxy-1                                 2/2     Running   0          70m
cluster1-haproxy-2                                 2/2     Running   0          70m
cluster1-pxc-0                                     1/1     Running   0          71m
cluster1-pxc-1                                     1/1     Running   0          70m
cluster1-pxc-2                                     1/1     Running   0          69m
percona-xtradb-cluster-operator-79d786dcfb-6clld   1/1     Running   0          121m

Since this operator is a custom resource, we can manipulate the perconaxtradbcluster resource to like the standard Kubernetes resource:

$ kubectl get perconaxtradbcluster
NAME       ENDPOINT               STATUS   PXC   PROXYSQL   HAPROXY   AGE
cluster1   cluster1-haproxy.pxc   ready    3                3         27h

You can also use the shorter resource name, "pxc", and try with the following commands:

$ kubectl describe pxc
$ kubectl edit pxc

When looking at the workload set, we can tell that the operator has created two StatefulSets:

$ kubectl get statefulsets -o wide
NAME               READY   AGE   CONTAINERS          IMAGES
cluster1-haproxy   3/3     26h   haproxy,pxc-monit   percona/percona-xtradb-cluster-operator:1.6.0-haproxy,percona/percona-xtradb-cluster-operator:1.6.0-haproxy
cluster1-pxc       3/3     26h   pxc                 percona/percona-xtradb-cluster:8.0.20-11.2

The operator will also create the corresponding services that will load-balanced connections to the respective pods:

$ kubectl get service
NAME                        TYPE           CLUSTER-IP     EXTERNAL-IP     PORT(S)                       AGE
cluster1-haproxy            ClusterIP      10.40.9.177    <none>          3306/TCP,3309/TCP,33062/TCP   3h27m
cluster1-haproxy-replicas   ClusterIP      10.40.0.236    <none>          3306/TCP                      3h27m
cluster1-pxc                ClusterIP      None           <none>          3306/TCP,33062/TCP            3h27m
cluster1-pxc-unready        ClusterIP      None           <none>          3306/TCP,33062/TCP            3h27m

The above output shows that the operator has created 4 services:

  • cluster1-haproxy - The service for a load-balanced MySQL single-master (3306), Proxy protocol (3309) and MySQL Admin (33062) - A new administrative port introduced in MySQL 8.0.14 and later. This is the service name or cluster IP address that the applications need to connect to have a single-master connection to the Galera cluster.
  • cluster1-haproxy-replicas - The service for a load-balanced MySQL multi-master (3306). This is the service name or cluster IP address that the applications need to connect to have a multi-master connection to the Galera cluster with round-robin balancing algorithm.
  • cluster1-pxc - The service for load-balanced PXC pods, bypassing HAProxy. By connecting directly to this service, Kubernetes will route the connection in round-robin fashion to all PXC pods, similar to what cluster-haproxy-replicase provides. The service has no public IP address assigned and is unavailable outside the cluster.
  • cluster1-pxc-unready - The 'unready' service is needed for pod address discovery during the application startup regardless of the Pod state. Proxysql and pxc pods should know about each other before the database becomes fully operational. The unready service has no public IP address assigned and is unavailable outside the cluster.

To connect via a MySQL client, simply run the following command:

$ kubectl run -i --rm --tty percona-client --image=percona:8.0 --restart=Never -- bash -il

This will create a transient Pod and immediately enter the container environment. Then, run the standard mysql client command with a proper credential:

bash-4.2$ mysql -uroot -pmypassword -h cluster1-haproxy -P3306 -e 'SELECT @@hostname'
mysql: [Warning] Using a password on the command line interface can be insecure.
+----------------+
| @@hostname     |
+----------------+
| cluster1-pxc-0 |
+----------------+

When we look at the Pod placement, all Percona XtraDB Cluster pods are located on a different Kubernetes host:

$ kubectl get pods -o wide --selector=app.kubernetes.io/component=pxc
NAME             READY   STATUS    RESTARTS   AGE   IP           NODE                                            NOMINATED NODE   READINESS GATES
cluster1-pxc-0   1/1     Running   0          67m   10.36.2.5    gke-my-k8s-cluster-default-pool-b80902cd-gp09   <none>           <none>
cluster1-pxc-1   1/1     Running   0          66m   10.36.1.10   gke-my-k8s-cluster-default-pool-b80902cd-rdv8   <none>           <none>
cluster1-pxc-2   1/1     Running   0          65m   10.36.0.11   gke-my-k8s-cluster-default-pool-b80902cd-jdc3   <none>           <none>

This will definitely improve the availability of the service, in case one of the Kubernetes hosts goes down. 

To scale up to 5 pods, we need to prepare another 2 new Kubernetes nodes beforehand to respect the pod affinity configuration (default to affinity.antiAffinityTopologyKey.topologyKey="kubernetes.io/hostname"). Then, run the following patch command to scale the Percona XtraDB Cluster to 5 nodes:

$ kubectl patch pxc cluster1 \
--type='json' -p='[{"op": "replace", "path": "/spec/pxc/size", "value": 5 }]'

Monitor the pod's creation by using kubectl get pods command:

$ kubectl get pods -o wide
NAME               READY   STATUS      RESTARTS   AGE   IP           NODE                                            NOMINATED NODE   READINESS GATES
cluster1-pxc-0     1/1     Running     0          27h   10.36.2.5    gke-my-k8s-cluster-default-pool-b80902cd-gp09   <none>           <none>
cluster1-pxc-1     1/1     Running     0          27h   10.36.1.10   gke-my-k8s-cluster-default-pool-b80902cd-rdv8   <none>           <none>
cluster1-pxc-2     1/1     Running     0          27h   10.36.0.11   gke-my-k8s-cluster-default-pool-b80902cd-jdc3   <none>           <none>
cluster1-pxc-3     1/1     Running     0          30m   10.36.7.2    gke-my-k8s-cluster-pool-1-ab14a45e-h1pf         <none>           <none>
cluster1-pxc-4     1/1     Running     0          13m   10.36.5.3    gke-my-k8s-cluster-pool-1-ab14a45e-01qn         <none>           <none>

Another 2 new Pods (cluster1-pxc-3 and cluster1-pxc-4) have been created on another 2 new Kubernetes nodes (gke-my-k8s-cluster-pool-1-ab14a45e-h1pf and gke-my-k8s-cluster-pool-1-ab14a45e-01qn). To scale down, simply change the value back to 3 in the above patch command. Note that Percona XtraDB Cluster should be running with an odd number of nodes to prevent split-brain.

Deploying an Application (WordPress)

In this example, we are going to deploy a WordPress application on top of our Percona XtraDB Cluster and HAProxy. Let's first prepare the YAML definition file like the following:

$ cat wordpress-deployment.yaml
apiVersion: v1
kind: Service
metadata:
  name: wordpress
  labels:
    app: wordpress
spec:
  ports:
    - port: 80
  selector:
    app: wordpress
    tier: frontend
  type: LoadBalancer
---
apiVersion: v1
kind: PersistentVolumeClaim
metadata:
  name: wp-pv-claim
  labels:
    app: wordpress
spec:
  accessModes:
    - ReadWriteOnce
  resources:
    requests:
      storage: 2Gi
---
apiVersion: apps/v1 # for versions before 1.9.0 use apps/v1beta2
kind: Deployment
metadata:
  name: wordpress
  labels:
    app: wordpress
spec:
  selector:
    matchLabels:
      app: wordpress
      tier: frontend
  strategy:
    type: Recreate
  template:
    metadata:
      labels:
        app: wordpress
        tier: frontend
    spec:
      containers:
      - image: wordpress:4.8-apache
        name: wordpress
        env:
        - name: WORDPRESS_DB_HOST
          value: cluster1-haproxy
        - name: WORDPRESS_DB_PASSWORD
          valueFrom:
            secretKeyRef:
              name: my-cluster-secrets
              key: root
        ports:
        - containerPort: 80
          name: wordpress
        volumeMounts:
        - name: wordpress-persistent-storage
          mountPath: /var/www/html
      volumes:
      - name: wordpress-persistent-storage
        persistentVolumeClaim:
          claimName: wp-pv-claim

Pay attention to theWORDPRESS_DB_HOST and WORDPRESS_DB_PASSWORD environment variables. The former variable where we defined "cluster1-haproxy" as the database host, instead of an individual database node and for the latter we specified the root password by instructing Kubernetes to read it from my-cluster-secrets object under key "root", which is equivalent to "mypassword" (after the base64 value was decoded). We skip defining the WORDPRESS_DB_USER environment variable since the default value is "root".

Now we can create our application:

$ kubectl apply -f wordpress-deployment.yaml

Check the service:

$ kubectl get service
NAME                        TYPE           CLUSTER-IP     EXTERNAL-IP     PORT(S)                       AGE
cluster1-haproxy            ClusterIP      10.40.9.177    <none>          3306/TCP,3309/TCP,33062/TCP   4h42m
cluster1-haproxy-replicas   ClusterIP      10.40.0.236    <none>          3306/TCP                      4h42m
cluster1-pxc                ClusterIP      None           <none>          3306/TCP,33062/TCP            4h42m
cluster1-pxc-unready        ClusterIP      None           <none>          3306/TCP,33062/TCP            4h42m
wordpress                   LoadBalancer   10.40.13.205   35.200.78.195   80:32087/TCP                  4h39m

At this point, we can connect to our WordPress application at http://35.200.78.195/ (the external IP address) and start configuring the WordPress application. At this point, our WordPress application is connected to one of the Percona XtraDB Cluster (single-master connection) via one of the HAProxy pods.

That's it for now. For more information, check out the Percona Kubernetes Operator for Percona XtraDB Cluster documentation. Happy containerizing!

Asynchronous Replication Automatic Failover in MySQL 8.0.22

$
0
0


Oracle recently released MySQL 8.0.22, and this new version came with a new asynchronous connection failover mechanism. It allows a replica to automatically establish an asynchronous replication connection to a new source, in case its existing one fails.

In this blog, we'll look at this connection failover mechanism.

Overview

The asynchronous failover mechanism can be used to keep a replica synchronized with a group of servers that share data (Multisource slave). It will move the replication connection to a new source when the existing source connection fails.

Working Principle

When the existing connection source fails, the replica first retries the same connection for the number of times specified by the MASTER_RETRY_COUNT. The interval between attempts is set by the MASTER_CONNECT_RETRY option. When these attempts are exhausted, the asynchronous connection failover mechanism takes over the failover process.

Note that by default the MASTER_RETRY_COUNT is 86400 (1 day --> 24 hours) and the MASTER_CONNECT_RETRY default value is 60.

To ensure that the asynchronous connection failover mechanism can be activated promptly, set MASTER_RETRY_COUNT to a minimal number that just allows a few retry attempts with the same source, in case the connection failure is caused by a transient network outage.

How to Activate Asynchronous Connection Failover

  • To activate asynchronous connection failover for a replication channel, set SOURCE_CONNECTION_AUTO_FAILOVER=1 on the CHANGE MASTER TO statement for the channel.
  • We have two new functions, which will help to add and delete the server entries from the source list. 
    • asynchronous_connection_failover_add_source (add the server entries from the source list)
    • asynchronous_connection_failover_delete_source (delete the server entries from the source list)

While using these functions, you need to specify the arguments like ('channel','host',port,'network_namespace',weight).

Example

mysql> select asynchronous_connection_failover_add_source('testing', '192.168.33.12', 3306, '', 100);

+----------------------------------------------------------------------------------------+

| asynchronous_connection_failover_add_source('testing', '192.168.33.12', 3306, '', 100) |

+----------------------------------------------------------------------------------------+

| The UDF asynchronous_connection_failover_add_source() executed successfully.           |

+----------------------------------------------------------------------------------------+

1 row in set (0.00 sec)

The source servers need to be configured in the table "mysql.replication_asynchronous_connection_failover". We can also use the table "performance_schema.replication_asynchronous_connection_failover" to view the available servers in the source list.

Note: If you are not using any channel based replication, this failover mechanism will work. While running the change master statement, there is no need to mention any channel name. But make sure GTID is enabled on all the servers.

Production Use Cases

Say you have three PXC-5.7 node with production data, running behind ProxySQL. Now, we will going to configure the channel based asynchronous replication under node 1 (192.168.33.12).

  • node 1 - 192.168.33.12
  • node 2 - 192.168.33.13
  • node 3 - 192.168.33.14
  • Read Replica - 192.168.33.15
mysql> change master to master_user='repl',master_password='Repl@123',master_host='192.168.33.12',master_auto_position=1,source_connection_auto_failover=1,master_retry_count=3,master_connect_retry=6 for channel "prod_replica";

Query OK, 0 rows affected, 2 warnings (0.01 sec)


mysql> start replica for channel 'prod_replica';

Query OK, 0 rows affected (0.00 sec)

Architecture Diagram

Test Case 1

We will going to add the failover settings:

 mysql> select asynchronous_connection_failover_add_source('prod_replica', '192.168.33.12', 3306, '', 100);

+---------------------------------------------------------------------------------------------+

| asynchronous_connection_failover_add_source('prod_replica', '192.168.33.12', 3306, '', 100) |

+---------------------------------------------------------------------------------------------+

| The UDF asynchronous_connection_failover_add_source() executed successfully.            |

+---------------------------------------------------------------------------------------------+

1 row in set (0.00 sec)


mysql>  select asynchronous_connection_failover_add_source('prod_replica', '192.168.33.13', 3306, '', 80);

+--------------------------------------------------------------------------------------------+

| asynchronous_connection_failover_add_source('prod_replica', '192.168.33.13', 3306, '', 80) |

+--------------------------------------------------------------------------------------------+

| The UDF asynchronous_connection_failover_add_source() executed successfully.               |

+--------------------------------------------------------------------------------------------+

1 row in set (0.01 sec)


mysql>  select asynchronous_connection_failover_add_source('prod_replica', '192.168.33.14', 3306, '', 60);

+--------------------------------------------------------------------------------------------+

| asynchronous_connection_failover_add_source('prod_replica', '192.168.33.14', 3306, '', 60) |

+--------------------------------------------------------------------------------------------+

| The UDF asynchronous_connection_failover_add_source() executed successfully.            |

+--------------------------------------------------------------------------------------------+

1 row in set (0.00 sec)


mysql> select * from mysql.replication_asynchronous_connection_failover;

+-------------------+---------------+------+-------------------+--------+

| Channel_name | Host         | Port | Network_namespace | Weight |

+-------------------+---------------+------+-------------------+--------+

| prod_replica      | 192.168.33.12 | 3306 |                   |    100 |

| prod_replica      | 192.168.33.13 | 3306 |                   |     80 |

| prod_replica      | 192.168.33.14 | 3306 |                   |     60 |

+-------------------+---------------+------+-------------------+--------+

3 rows in set (0.00 sec)

Ok all good, I can activate the auto_failover. Let’s stop node 1 (192.168.33.12) MySQL. ProxySQL will promote the next suitable master. 

[root@centos12 lib]# service mysqld stop

Redirecting to /bin/systemctl stop mysqld.service

In the Replica Server

mysql> show replica status\G

*************************** 1. row ***************************

               Slave_IO_State: Reconnecting after a failed master event read

                  Master_Host: 192.168.33.12

                  Master_User: repl

                  Master_Port: 3306

                Connect_Retry: 6

              Master_Log_File: binlog.000004

          Read_Master_Log_Pos: 1143

               Relay_Log_File: relay-bin-testing.000006

                Relay_Log_Pos: 1352

        Relay_Master_Log_File: binlog.000004

             Slave_IO_Running: Connecting

            Slave_SQL_Running: Yes

              Replicate_Do_DB: 

Last_IO_Error: error reconnecting to master 'repl@192.168.33.12:3306' - retry-time: 10 retries: 2 message: Can't connect to MySQL server on '192.168.33.12' (111)

The IO thread is in "connecting" state. This means it is trying to establish the connection from the existing source (node 1) based on the master_retry_count and master_connect_retry settings.

After a few seconds, you can see the source_host was changed to node 2 (192.168.33.13). Now the failover is done.

mysql> show replica status\G

*************************** 1. row ***************************

               Slave_IO_State: Waiting for master to send event

                  Master_Host: 192.168.33.13

                  Master_User: repl

                  Master_Port: 3306

                Connect_Retry: 6

              Master_Log_File: binlog.000004

          Read_Master_Log_Pos: 1162

               Relay_Log_File: relay-bin-testing.000007

                Relay_Log_Pos: 487

        Relay_Master_Log_File: binlog.000004

             Slave_IO_Running: Yes

            Slave_SQL_Running: Yes

             Last_IO_Error:

From the Error Log

2020-10-29T22:22:05.679951Z 54 [ERROR] [MY-010584] [Repl] Slave I/O for channel 'prod_replica': error reconnecting to master 'repl@192.168.33.12:3306' - retry-time: 10 retries: 3 message: Can't connect to MySQL server on '192.168.33.12' (111), Error_code: MY-002003

2020-10-29T22:22:05.681121Z 58 [Warning] [MY-010897] [Repl] Storing MySQL user name or password information in the master info repository is not secure and is therefore not recommended. Please consider using the USER and PASSWORD connection options for START SLAVE; see the 'START SLAVE Syntax' in the MySQL Manual for more information.

2020-10-29T22:22:05.682830Z 58 [System] [MY-010562] [Repl] Slave I/O thread for channel 'prod_replica': connected to master 'repl@192.168.33.13:3306',replication started in log 'FIRST' at position 2660

2020-10-29T22:22:05.685175Z 58 [Warning] [MY-010549] [Repl] The master's UUID has changed, although this should not happen unless you have changed it manually. The old UUID was 31b5b7d0-1a25-11eb-8076-080027090068.

(END)

Test Case 2 

While running the change master statement, there is no need to mention any channel name, whether you are using channel based replication or not.

Example

mysql> change master to master_user='repl',master_password='Repl@123',master_host='192.168.33.12',master_auto_position=1,source_connection_auto_failover=1,master_retry_count=3,master_connect_retry=10;

Query OK, 0 rows affected, 2 warnings (0.01 sec)


mysql> start replica;

Query OK, 0 rows affected (0.00 sec)

Then add the failover settings like below,

select asynchronous_connection_failover_add_source('', '192.168.33.12', 3306, '', 100);

select asynchronous_connection_failover_add_source('', '192.168.33.13', 3306, '', 80);

select asynchronous_connection_failover_add_source('', '192.168.33.14', 3306, '', 60);


 mysql> select * from mysql.replication_asynchronous_connection_failover;

+--------------+---------------+------+-------------------+--------+

| Channel_name | Host          | Port | Network_namespace | Weight |

+--------------+---------------+------+-------------------+--------+

|              | 192.168.33.12 | 3306 |                   |    100 |

|              | 192.168.33.13 | 3306 |                   |     80 |

|              | 192.168.33.14 | 3306 |                   |     60 |

+--------------+---------------+------+-------------------+--------+

3 rows in set (0.00 sec)

Now, I’m going to stop node 1 (192.168.33.12).

Replication Error

Last_IO_Error: error connecting to master 'repl@192.168.33.12:3306' - retry-time: 10 retries: 2 message: Can't connect to MySQL server on '192.168.33.12' (111)

From the Error Log 

2020-10-30T00:38:03.471482Z 27 [ERROR] [MY-010584] [Repl] Slave I/O for channel '': error connecting to master 'repl@192.168.33.12:3306' - retry-time: 10 retries: 3 message: Can't connect to MySQL server on '192.168.33.12' (111), Error_code: MY-002003

2020-10-30T00:38:03.472002Z 29 [Warning] [MY-010897] [Repl] Storing MySQL user name or password information in the master info repository is not secure and is therefore not recommended. Please consider using the USER and PASSWORD connection options for START SLAVE; see the 'START SLAVE Syntax' in the MySQL Manual for more information.

2020-10-30T00:38:03.473493Z 29 [System] [MY-010562] [Repl] Slave I/O thread for channel '': connected to master 'repl@192.168.33.13:3306',replication started in log 'FIRST' at position 234

2020-10-30T00:38:03.475471Z 29 [Warning] [MY-010549] [Repl] The master's UUID has changed, although this should not happen unless you have changed it manually. The old UUID was 1ff8a919-1a39-11eb-a27a-080027090068.

Using ClusterControl

Now we will use ClusterControl to repeat this automatic failover process. I have three nodes pxc (5.7) deployed by ClusterControl. I have an 8.0.22 replication slave under my PXC node2 and we will going to add this read replica using ClusterControl.

Step 1

Setup the passwordless SSH login from ClusterControl node to read replica node.

$ ssh-copy-id -i ~/.ssh/id_rsa 192.168.33.15

Step 2

Go to ClusterControl and click the drop down icon and select Add Replication slave option.

Step 3

Then choose the “Existing Replication Slave” option and enter the read replica IP then click “Add Replication Slave”.

Step 4

A job will be triggered and you can monitor the progress at ClusterControl > Logs > Jobs. Once the process is complete, the slave will show up in your Overview page as highlighted in the following screenshot.

Now you can check the current topology at ClusterControl > Topology 

Replica Auto Failover Process

Now I’m going to do failover testing and added the below settings to this function (asynchronous_connection_failover_add_source) in my read replica.

 select asynchronous_connection_failover_add_source('prod_replica', '192.168.33.12', 3306, '', 100);

 select asynchronous_connection_failover_add_source('prod_replica', '192.168.33.13', 3306, '', 80);

 select asynchronous_connection_failover_add_source('prod_replica', '192.168.33.14', 3306, '', 60);


mysql> select * from mysql.replication_asynchronous_connection_failover;

+--------------+---------------+------+-------------------+--------+

| Channel_name | Host          | Port | Network_namespace | Weight |

+--------------+---------------+------+-------------------+--------+

| prod_replica | 192.168.33.12 | 3306 |                   |    100 |

| prod_replica | 192.168.33.13 | 3306 |                   |     80 |

| prod_replica | 192.168.33.14 | 3306 |                   |     60 |

+--------------+---------------+------+-------------------+--------+

3 rows in set (0.00 sec)


mysql> select CONNECTION_RETRY_INTERVAL,CONNECTION_RETRY_COUNT,SOURCE_CONNECTION_AUTO_FAILOVER from performance_schema.replication_connection_conf

iguration;

+---------------------------+------------------------+---------------------------------+

| CONNECTION_RETRY_INTERVAL | CONNECTION_RETRY_COUNT | SOURCE_CONNECTION_AUTO_FAILOVER |

+---------------------------+------------------------+---------------------------------+

|                         6 |                      3 | 1                               |

+---------------------------+------------------------+---------------------------------+

1 row in set (0.00 sec)

I’m going to stop node 2 (192.168.33.13). In ClusterControl, the (enable_cluster_autorecovery) parameter is enabled so it will promote the next suitable master.

Now my current master is down, so the read replica is retrying to connect the master.

Replication Error From Read Replica

Last_IO_Error: error connecting to master 'repl@192.168.33.13:3306' - retry-time: 6 retries: 2 message: Can't connect to MySQL server on '192.168.33.13' (111)

Once the ClusterControl promotes the next suitable master, my read replica will connect to any one of the available cluster nodes.

The automatic failover process is completed and my read replica joined back to node 1 (192.168.33.13) server.

Conclusion

This is one of the great features in MySQL, there is no manual intervention needed. This auto failover process can save you some time. And it reduces the replica server outage. Worth noting, when my old master came back to rotation, the replication connection would not switch back to the old master.

How to Deploy Percona Server for MySQL for High Availability

$
0
0

Percona Server for MySQL 8.0 offers a number of clustering solutions for high availability out-of-the-box:

  • Single-master:
    • Asynchronous replication
    • Semi synchronous replication
  • Multi-master:
    • Group replication
    • InnoDB Cluster (a combination of MySQL Router, MySQL Shell and Percona Server with Group Replication)

The most popular, battle-tested, and highly scalable solution is, of course, asynchronous replication. In this blog post, we are going to deploy a Percona Server replication setup specifically for high availability. The instructions described here are based on CentOS 7.

Installing Percona Server

For high availability, we need at least two nodes in a simple master-slave replication setup:

  • db1 - master (192.168.0.61)
  • db2 - slave (192.168.0.62)

The steps described in this section should be performed on all database nodes (db1 and db2). We will start by installing the Percona repository package:

$ yum -y install https://repo.percona.com/yum/percona-release-latest.noarch.rpm

The latest stable version at this point is Percona Server for MySQL 8.0, but by default, the repository package is only configured up until version 5.7. The percona-release package contains a script that can enable additional repositories for the newer products. Let's run that script and enabled 8.0 repositories:

$ percona-release setup ps80

Then install the latest Percona Server and Percona Xtrabackup:

$ yum -y install percona-server-server percona-xtrabackup-80

At this moment in time, you should get a Percona Server for MySQL 8.0.21 installed. All dependency packages will be installed like shared-compat, shared and client packages. We can then enable the MySQL service on startup and start the service:

$ systemctl enable mysql
$ systemctl start mysql

A new root password will be generated during the first startup. We need to retrieve the root password information first from the MySQL error log (default is /var/log/mysqld.log in RHEL-based systems):

$ cat /var/log/mysqld.log | grep temporary
2020-11-06T04:53:07.402040Z 6 [Note] [MY-010454] [Server] A temporary password is generated for root@localhost: o%(_M>t1)R-P

As you can see the generated password is "o%(_M>t1)R-P". Next, we need to perform a post-installation task to secure the MySQL server installation. Run the following command:

$ mysql_secure_installation

Securing the MySQL server deployment.

Enter password for user root:

The existing password for the user account root has expired. Please set a new password.


New password:
Re-enter new password:

The 'validate_password' component is installed on the server.
The subsequent steps will run with the existing configuration
of the component.

Using existing password for root.


Estimated strength of the password: 100
Change the password for root ? ((Press y|Y for Yes, any other key for No) : y

New password:

Re-enter new password:

Estimated strength of the password: 100

Do you wish to continue with the password provided?(Press y|Y for Yes, any other key for No) : y

By default, a MySQL installation has an anonymous user,
allowing anyone to log into MySQL without having to have
a user account created for them. This is intended only for
testing, and to make the installation go a bit smoother.

You should remove them before moving into a production
environment.

Remove anonymous users? (Press y|Y for Yes, any other key for No) : y
Success.

Normally, root should only be allowed to connect from
'localhost'. This ensures that someone cannot guess at
the root password from the network.

Disallow root login remotely? (Press y|Y for Yes, any other key for No) : y
Success.

By default, MySQL comes with a database named 'test' that
anyone can access. This is also intended only for testing,
and should be removed before moving into a production
environment.

Remove test database and access to it? (Press y|Y for Yes, any other key for No) : y
 - Dropping test database...
Success.

 - Removing privileges on test database...
Success.

Reloading the privilege tables will ensure that all changes
made so far will take effect immediately.

Reload privilege tables now? (Press y|Y for Yes, any other key for No) : y
Success.

All done!

The generated root password will be expired immediately upon the first root login. The above helper script helps us to configure a new MySQL root password, disabling remote login for root, remove test database and anonymous users and also reload the privilege tables.

We are now ready to configure the high availability feature for Percona Server 8.0.

Semi synchronous Replication

Semi synchronous replication falls between asynchronous and fully synchronous replication. The source waits until at least one replica has received and logged the events, and then commits the transaction. The source does not wait for all replicas to acknowledge receipt, and it requires only an acknowledgment from the replicas, not that the events have been fully executed and committed on the replica side. Semi synchronous replication, therefore, guarantees that if the source crashes, all the transactions that it has committed have been transmitted to at least one replica.

For the best replication integrity, choose semi-synchronous replication. To configure it, on the first node, db1 (192.168.0.61), add the following lines inside /etc/my.cnf (it must be under the [mysqld] section):

# Compatibility
default-authentication-plugin = mysql_native_password

# Replication
server_id = 61 # must be distinct on all nodes in the cluster
binlog_format = ROW
log_bin = binlog
log_slave_updates = 1
gtid_mode = ON
enforce_gtid_consistency = 1
binlog_expire_logs_seconds = 604800 # 7 days
sync_binlog = 1
report_host = 192.168.0.61 # IP address of this host
read_only = OFF # Set ON on slave
super_read_only = OFF # Set ON on slave

# Replication safety
master_info_repository = TABLE
relay_log_info_repository = TABLE
relay_log_recovery = ON

# Semi-sync
plugin_load_add = rpl_semi_sync_master=semisync_master.so
plugin_load_add = rpl_semi_sync_slave=semisync_slave.so
rpl_semi_sync_master_enabled = ON
rpl_semi_sync_master_timeout = 1000
rpl_semi_sync_slave_enabled = ON

On the second node, db2 (192.168.0.62), add the following lines inside /etc/my.cnf (it must be under the [mysqld] section):

# Compatibility
default-authentication-plugin = mysql_native_password

# Replication
server_id = 62 # must be distinct on all nodes in the cluster
binlog_format = ROW
log_bin = binlog
log_slave_updates = 1
gtid_mode = ON
enforce_gtid_consistency = 1
binlog_expire_logs_seconds = 604800 # 7 days
sync_binlog = 1
report_host = 192.168.0.62 # IP address of this host
read_only = ON # Set ON on slave
super_read_only = ON # Set ON on slave

# Replication safety
master_info_repository = TABLE
relay_log_info_repository = TABLE
relay_log_recovery = ON

# Semi-sync
plugin_load_add = rpl_semi_sync_master=semisync_master.so
plugin_load_add = rpl_semi_sync_slave=semisync_slave.so
rpl_semi_sync_master_enabled = ON
rpl_semi_sync_master_timeout = 1000
rpl_semi_sync_slave_enabled = ON

We can then proceed to set up the replication link as described in the "Setting up Replication Link" further down.

Asynchronous Replication

For asynchronous replication, simply remove all semi-synchronous replication related options and we should be good. On the first node, db1 (192.168.0.61), add the following lines inside /etc/my.cnf (it must be under the [mysqld] section):

# Compatibility
default-authentication-plugin = mysql_native_password

# Replication
server_id = 61 # must be distinct on all nodes in the cluster
binlog_format = ROW
log_bin = binlog
log_slave_updates = 1
gtid_mode = ON
enforce_gtid_consistency = 1
binlog_expire_logs_seconds = 604800 # 7 days
sync_binlog = 1
report_host = 192.168.0.61 # IP address of this host
read_only = OFF # Set ON on slave
super_read_only = OFF # Set ON on slave

# Replication safety
master_info_repository = TABLE
relay_log_info_repository = TABLE
relay_log_recovery = ON

On the second node, db2 (192.168.0.62), add the following lines inside /etc/my.cnf (it must be under the [mysqld] section):

# Compatibility
default-authentication-plugin = mysql_native_password

# Replication
server_id = 62 # must be distinct on all nodes in the cluster
binlog_format = ROW
log_bin = binlog
log_slave_updates = 1
gtid_mode = ON
enforce_gtid_consistency = 1
binlog_expire_logs_seconds = 604800 # 7 days
sync_binlog = 1
report_host = 192.168.0.62 # IP address of this host
read_only = ON # Set ON on slave
super_read_only = ON # Set ON on slave

# Replication safety
master_info_repository = TABLE
relay_log_info_repository = TABLE
relay_log_recovery = ON

We can then proceed to set up the replication link as described in the "Setting up Replication Link" down below.

Setting up the Replication Link

On the master (db1), create a slave user and allow the user to connect from all hosts under this network (using % wildcard):

mysql> CREATE USER 'slave'@'192.168.0.%' IDENTIFIED WITH mysql_native_password BY 'c7SdB239@8XMn2&9';
mysql> GRANT REPLICATION SLAVE ON *.* TO 'slave'@'192.168.0.%';

On the slave (db2), reset the binary logs, configure the replication credentials and start the replication process:

mysql> RESET MASTER;
mysql> CHANGE MASTER TO MASTER_HOST = '192.168.0.61', MASTER_USER = 'slave', MASTER_PASSWORD = 'c7SdB239@8XMn2&9', MASTER_AUTO_POSITION = 1;
mysql> START SLAVE;

Check the replication status:

mysql> SHOW SLAVE STATUS\G
*************************** 1. row ***************************
               Slave_IO_State: Waiting for master to send event
                  Master_Host: 192.168.0.61
                  Master_User: slave
                  Master_Port: 3306
                Connect_Retry: 60
              Master_Log_File: binlog.000008
          Read_Master_Log_Pos: 912
               Relay_Log_File: db2-relay-bin.000007
                Relay_Log_Pos: 1081
        Relay_Master_Log_File: binlog.000008
             Slave_IO_Running: Yes
            Slave_SQL_Running: Yes
              Replicate_Do_DB:
          Replicate_Ignore_DB:
           Replicate_Do_Table:
       Replicate_Ignore_Table:
      Replicate_Wild_Do_Table:
  Replicate_Wild_Ignore_Table:
                   Last_Errno: 0
                   Last_Error:
                 Skip_Counter: 0
          Exec_Master_Log_Pos: 912
              Relay_Log_Space: 1500
              Until_Condition: None
               Until_Log_File:
                Until_Log_Pos: 0
           Master_SSL_Allowed: No
           Master_SSL_CA_File:
           Master_SSL_CA_Path:
              Master_SSL_Cert:
            Master_SSL_Cipher:
               Master_SSL_Key:
        Seconds_Behind_Master: 0
Master_SSL_Verify_Server_Cert: No
                Last_IO_Errno: 0
                Last_IO_Error:
               Last_SQL_Errno: 0
               Last_SQL_Error:
  Replicate_Ignore_Server_Ids:
             Master_Server_Id: 66
                  Master_UUID: f60cf793-1feb-11eb-af72-5254008afee6
             Master_Info_File: mysql.slave_master_info
                    SQL_Delay: 0
          SQL_Remaining_Delay: NULL
      Slave_SQL_Running_State: Slave has read all relay log; waiting for more updates
           Master_Retry_Count: 86400
                  Master_Bind:
      Last_IO_Error_Timestamp:
     Last_SQL_Error_Timestamp:
               Master_SSL_Crl:
           Master_SSL_Crlpath:
           Retrieved_Gtid_Set: f60cf793-1feb-11eb-af72-5254008afee6:5-7
            Executed_Gtid_Set: f60cf793-1feb-11eb-af72-5254008afee6:1-7
                Auto_Position: 1
         Replicate_Rewrite_DB:
                 Channel_Name:
           Master_TLS_Version:
       Master_public_key_path:
        Get_master_public_key: 0
            Network_Namespace:

Pay attention to the following important status to determine if the replication is configured correctly and the slave has caught up with the master:

  • Slave_IO_Running: Yes
  • Slave_SQL_Running: Yes
  • Seconds_Behind_Master: 0

If semi-synchronous replication is enabled, you should get the following output on the master:

mysql> SHOW STATUS LIKE '%semi%status';
+-----------------------------+-------+
| Variable_name               | Value |
+-----------------------------+-------+
| Rpl_semi_sync_master_status | ON    |
| Rpl_semi_sync_slave_status  | OFF   |
+-----------------------------+-------+

While on the slave, the status is as below:

mysql> SHOW STATUS LIKE '%semi%status';
+-----------------------------+-------+
| Variable_name               | Value |
+-----------------------------+-------+
| Rpl_semi_sync_master_status | OFF   |
| Rpl_semi_sync_slave_status  | ON    |
+-----------------------------+-------+

For asynchronous replication, the above query shall return nothing (empty set), because the semi-synchronous replication plugins are not enabled. In one replication set, it is possible to have a mix of slaves host replicating with asynchronous and semi-synchronous replication.

Deploying Percona Server for MySQL using ClusterControl

It's practically easy to deploy a master-slave Percona Server replication with ClusterControl, and by default, ClusterControl will configure the replication deployment with an asynchronous replication. Simply prepare the nodes that you want to deploy, and in this example, we are going to deploy a three-node Percona Server for MySQL 8.0 with master-slave replication. With ClusterControl comes into the picture, we are required to have an additional node for ClusterControl. Therefore, our setup looks like this:

  • ClusterControl - cc (192.168.0.19)
  • Master - db1 (192.168.0.61)
  • Slave - db2 (192.168.0.62)
  • Slave - db3 (192.168.0.63)

On the ClusterControl server, install ClusterControl using the installer script. As root, run the following:

$ wget http://severalnines.com/downloads/cmon/install-cc
$ chmod 755 install-cc
$ ./install-cc

Follow the installation instructions until it finishes. Then, open a web browser and go to http://{ClusterControl_IP_address}/clustercontrol  and create a default admin user and password. Next, we need to set up passwordless SSH from the ClusterControl server to all database nodes. As the root user, we need to first generate an SSH key:

$ whoami
root
$ ssh-keygen -t rsa # press Enter on all prompts

Then, copy the created SSH public key to all database nodes:

$ ssh-copy-id -i ~/.ssh/id_rsa root@192.168.0.61 # db1
$ ssh-copy-id -i ~/.ssh/id_rsa root@192.168.0.62 # db2
$ ssh-copy-id -i ~/.ssh/id_rsa root@192.168.0.63 # db3

We are now ready to start the cluster deployment. Go to ClusterControl -> Deploy -> MySQL Replication and specify the required details as below:

Then, click "Continue" to proceed to the next step where we configure the MySQL installation specification:

Choose "Percona" for the Vendor and 8.0 as the Version. Keep the rest as default and enter the MySQL root password. Click "Continue" to proceed to the host and topology configuration:

Specify the IP address or hostname of the database hosts one by one and make sure you get the green tick icons after each insertion. This indicates that ClusterControl is able to reach the corresponding hosts via passwordless SSH with the provided SSH user and key as defined in step 1. Click on the "Deploy" button to start the deployment.

ClusterControl then triggers a deployment job where you can monitor the deployment progress by going to ClusterControl -> Activity -> Jobs -> Create Cluster -> Full Job Details, as shown in the following screenshot:

Once the process completes, you should see the cluster is listed in the Dashboard:

That's it. The deployment is now complete.


Full-Text Searches in MySQL: The Good, the Bad and the Ugly

$
0
0

Sometimes when searching in a MySQL database you might want to run full-text search queries against character-based data. Today we’re discussing the advantages and disadvantages of such search methods.

What are Full-Text Searches in MySQL?

Full-text search is a technique that enables you to search for records that might not perfectly match the search criteria. Full-text searches in MySQL are performed when certain indexes are in use and those indexes have many unique nuances including the following:

  • In order for the index to be considered a full-text index, the index must be of the FULLTEXT type.
  • FULLTEXTindexes can only be used on tables running the InnoDB or MyISAM storage engines.
  • FULLTEXTindexes can only be created for CHAR, VARCHAR, or TEXT columns.
  • FULLTEXTindexes are only used when the MATCH() AGAINST() clause is used.
  • Full-text searches have three modes: the natural language mode, the boolean mode, and the query expansion mode.

A FULLTEXT index is a special type of index that finds keywords in the text instead of comparing the values to the values in the index. Although FULLTEXT searching is different from other types of matching, do note that you can have a BTREE index and a FULLTEXT index on the same column at the same time - they will not conflict because they are suited for different purposes.

Full-Text Search Types

When running full-text searches in MySQL, keep in mind that there are three search types to choose from:

  1. A natural language search type - such a search mode interprets the search string as a literal phrase. Enabled by default if no modifier is specified or when the IN NATURAL LANGUAGE MODE modifier is specified;
  2. A query expansion search type - such a search mode performs the search twice. When searching the second time, the result set includes a few most relevant documents from the first search. Enabled using the WITH QUERY EXPANSION modifier;
  3. A boolean search type - such a search mode enables searching for complex queries that can include boolean operators such as less than (“<”) and more than (“>”) operators, subexpressions (“(” and “)”), the plus (+) sign, the minus (-) sign, double quotes (“”), an operator that lowers the value’s contribution to the results (~) and the wildcard operator (*) - the wildcard operator allows searching with fuzzy matching (for example, “demo*” would also match “demonstration”). Enabled using the IN BOOLEAN MODE modifier.

Full-Text Searches with the Natural Language Search Mode

A natural language search mode, as noted above, is enabled by default or when the IN NATURAL LANGUAGE MODE modifier is specified. This mode performs a natural language search against a given text collection (one or more columns). The basic query format of full-text searches in MySQL should be similar to the following:

SELECT * FROM table WHERE MATCH(column) AGAINST(“string” IN NATURAL LANGUAGE MODE);

When MATCH() is used together with a WHERE clause, the rows are automatically sorted by the highest relevance first. To search for an exact string, enclose it with double quotes.

Full-Text Searches with the Query Expansion Mode

Full-text searches also support the query expansion mode. Such a search mode is frequently used when the user relies on implied knowledge - for example, the user might search for “DBMS” hoping to see both “MongoDB” and “MySQL” in the search results. The reason why the user might be able to rely on some implied knowledge when using such a search mode is pretty simple - a full-text search with the query expansion mode works by performing the search twice: the second search phrase is the first search phrase concatenated with a few most relevant entries from the first search. That means that, for example, if in the first search one of the rows would contain the word “DBMS” and the word “MySQL”, the second search would find the entries that would include the word “MySQL” even if they do not contain “DBMS”. The query format that would use the query expansion mode would look like so:

SELECT * FROM table WHERE MATCH(column) AGAINST(“string” WITH QUERY EXPANSION); 

Full-text Searches Using the Boolean Mode

The boolean mode is perhaps one of the most interesting things that MySQL full-text search has to offer. This mode has many caveats unique to it because it allows you to expand the search capabilities using boolean operators. When the boolean mode is in use, certain characters can have special meaning at the beginning or end of words. For example:

  • +” means AND;
  • -” means NOT;
  • The “(“ and “)” operators allows to create subexpressions;
  • <” and “>” operators change the rank of the search value lower or higher;
  • ~” lowers the value’s contribution to the search results;
  • Double quotes (“”) only match literal values;
  • *” is a wildcard operator (refer to the explanation above).

These operators allow you to expand the functionality of the search: for example, if you would want to retrieve all rows that contain the word “Demo”, but not “Demo2”, you could use a query like so:

SELECT * FROM table WHERE MATCH(column) AGAINST (“+Demo -Demo2” IN BOOLEAN MODE);

You can also use double quotes together with single quotes like so:

SELECT * FROM table WHERE MATCH(column) AGAINST(‘“search string”’ IN BOOLEAN MODE);

Full-Text Search Gotchas

Before using full-text search in MySQL, do keep in mind that the search does have a few “gotchas”:

  • Both the InnoDB and MyISAM storage engines have their own lists of stopwords. InnoDB stopword list can be found here, MyISAM stopword list can be found here.
    • To define your own stopword list for InnoDB, define a table with the same structure as the INNODB_FT_DEFAULT_STOPWORD table, insert stopwords there, then set the value of the innodb_ft_server_stopword_table option in the form of db_name/table_name.
    • To define your own stopword list for MyISAM, set the ft_stopword_file variable to the path name of the file containing the stopword list. In the file stopwords can be separated by any nonalphanumberic character except “_” and “‘“. The default stopword file is located at storage/myisam/ft_static.c. Stopwords can be disabled by setting the variable to an empty string.
  • Full-text searches are not supported on partitioned tables.
  • All columns in a FULLTEXT index must use the same character set and collation.
  • Full-text search operations do not treat the % string as a wildcard.

Here’s another catch: you might also want to keep in mind that the built-in FULLTEXT parser determines where words start and end by looking at certain characters including the space (“ “), comma (“,”) and period (“.”) meaning that if your search string contains one or more of those characters, the search results might not be accurate. For example, if your database contains 5 rows with the string “test.demo”, the search query “test.demo” might return more (10, 15 etc.) results including “demo”, “string.demo_example” etc. because it’s going to search for “demo” instead of “test.demo”, so you might be stuck with a lot of irrelevant matches. MySQL does offer a workaround for this issue if you’re willing to write your own plugin in C or C++ (see MySQL documentation), but until then, you cannot do much.

The full list of MySQL’s full-text restrictions can be seen at the MySQL’s documentation page.

Summary

The MySQL full-text search capability provides a simple way to implement various search techniques (natural language search, query expansion search, and boolean search) into your application running MySQL. Each of those search techniques have their own caveats and each of them might be suited for different purposes - when deciding whether to use full-text searching, keep in mind that this type of searching has many subtleties unique to itself, know both the benefits and disadvantages of utilizing full-text searching in MySQL and choose wisely.

Tags: 

Monitoring Percona Server for MySQL - Key Metrics

$
0
0

In this blog post, we are going to look into some key metrics and status when monitoring a Percona Server for MySQL to help us fine-tune the MySQL server configuration for a long run. Just for the heads up, Percona Server has some monitoring metrics that are only available on this build. When comparing on version 8.0.20, the following 51 statuses are only available on Percona Server for MySQL, which are not available in the upstream Oracle's MySQL Community Server:

  • Binlog_snapshot_file
  • Binlog_snapshot_position
  • Binlog_snapshot_gtid_executed
  • Com_create_compression_dictionary
  • Com_drop_compression_dictionary
  • Com_lock_tables_for_backup
  • Com_show_client_statistics
  • Com_show_index_statistics
  • Com_show_table_statistics
  • Com_show_thread_statistics
  • Com_show_user_statistics
  • Innodb_background_log_sync
  • Innodb_buffer_pool_pages_LRU_flushed
  • Innodb_buffer_pool_pages_made_not_young
  • Innodb_buffer_pool_pages_made_young
  • Innodb_buffer_pool_pages_old
  • Innodb_checkpoint_age
  • Innodb_ibuf_free_list
  • Innodb_ibuf_segment_size
  • Innodb_lsn_current
  • Innodb_lsn_flushed
  • Innodb_lsn_last_checkpoint
  • Innodb_master_thread_active_loops
  • Innodb_master_thread_idle_loops
  • Innodb_max_trx_id
  • Innodb_oldest_view_low_limit_trx_id
  • Innodb_pages0_read
  • Innodb_purge_trx_id
  • Innodb_purge_undo_no
  • Innodb_secondary_index_triggered_cluster_reads
  • Innodb_secondary_index_triggered_cluster_reads_avoided
  • Innodb_buffered_aio_submitted
  • Innodb_scan_pages_contiguous
  • Innodb_scan_pages_disjointed
  • Innodb_scan_pages_total_seek_distance
  • Innodb_scan_data_size
  • Innodb_scan_deleted_recs_size
  • Innodb_scrub_log
  • Innodb_scrub_background_page_reorganizations
  • Innodb_scrub_background_page_splits
  • Innodb_scrub_background_page_split_failures_underflow
  • Innodb_scrub_background_page_split_failures_out_of_filespace
  • Innodb_scrub_background_page_split_failures_missing_index
  • Innodb_scrub_background_page_split_failures_unknown
  • Innodb_encryption_n_merge_blocks_encrypted
  • Innodb_encryption_n_merge_blocks_decrypted
  • Innodb_encryption_n_rowlog_blocks_encrypted
  • Innodb_encryption_n_rowlog_blocks_decrypted
  • Innodb_encryption_redo_key_version
  • Threadpool_idle_threads
  • Threadpool_threads

Check out the Extended InnoDB Status page for more information on each of the monitoring metrics above. Note that some extra status like thread pool is only available in Oracle's MySQL Enterprise. Check out the Percona Server for MySQL 8.0 documentation to see all of the improvements specifically for this build over Oracle's MySQL Community Server 8.0.

To retrieve the MySQL global status, simply use one of the following statements:

mysql> SHOW GLOBAL STATUS;

mysql> SHOW GLOBAL STATUS LIKE '%connect%'; -- list all status that contain string "connect"

mysql> SELECT * FROM performance_schema.global_status;

mysql> SELECT * FROM performance_schema.global_status WHERE VARIABLE_NAME LIKE '%connect%'; -- list all status that contain string "connect"

Database State and Overview

We will start with the uptime status, the number of seconds that the server has been up. 

All com_* status are the statement counter variables indicate the number of times each statement has been executed. There is one status variable for each type of statement. For example, com_delete and com_update count DELETE and UPDATE statements, respectively. The com_delete_multi and com_update_multi are similar but apply to DELETE and UPDATE statements that use multiple-table syntax.

To list out all the running process by MySQL, just run one of the following statements:

mysql> SHOW PROCESSLIST;

mysql> SHOW FULL PROCESSLIST;

mysql> SELECT * FROM information_schema.processlist;

mysql> SELECT * FROM information_schema.processlist WHERE command <> 'sleep'; -- list all active processes except 'sleep' command.

Connections and Threads

Current Connections

The ratio of currently open connections (connection thread). If the ratio is high, it indicates there are many concurrent connections to the MySQL server and could lead to "Too many connections" error. To get the connection percentage:

Current connections(%) = (threads_connected / max_connections) x 100

A good value should be 80% and below. Try increasing the max_connections variable or inspect the connections using SHOW FULL PROCESSLIST. When "Too many connections" errors happen, the MySQL database server will become unavailable for the non-super user until some connections are freed up. Note that increasing the max_connections variable could also potentially increase MySQL's memory footprint.

Maximum Connections Ever Seen

The ratio of maximum connections to MySQL server that was ever seen. A simple calculation would be:

Max connections ever seen(%) = (max_used_connections / max_connections) x 100

A good value should be below 80%. If the ratio is high, it indicates that MySQL has once reached a high number of connections that would lead to ‘too many connections’ error. Inspect the current connections ratio to see if it is indeed staying low consistently. Otherwise, increase the max_connections variable. Check the max_used_connections_time status to indicate when the max_used_connections status reached its current value.

Threads Cache Hit Rate

The status of threads_created is the number of threads created to handle connections. If the threads_created is big, you may want to increase the thread_cache_size value. The cache hit/miss rate can be calculated as:

Threads cache hit rate (%) = (threads_created / connections) x 100

It’s a fraction that gives an indication of thread cache hit rate. The closer less than 50%, the better. If your server sees hundreds of connections per second you should normally set thread_cache_size high enough so that most new connections use cached threads.

Query Performance

Full Table Scans

The ratio of full table scans, an operation that requires reading the entire contents of a table, rather than just selected portions using an index. This value is high if you are doing a lot of queries that require sorting of results or table scans. Generally this suggests that tables are not properly indexed or that your queries are not written to take advantage of the indexes you have. To calculate the percentage of full table scans:

Full table scans (%) = (handler_read_rnd_next + handler_read_rnd) / 

(handler_read_rnd_next + handler_read_rnd + handler_read_first + handler_read_next + handler_read_key + handler_read_prev) 

x 100

A good value should be below 25%. Examine the MySQL slow query log output to find out the suboptimal queries.

Select Full Join

The status of select_full_join is the number of joins that perform table scans because they do not use indexes. If this value is not 0, you should carefully check the indexes of your tables. 

Select Range Check

The status of select_range_check is the number of joins without keys that check key usage after each row. If this is not 0, you should carefully check the indexes of your tables. 

Sort Passes

The ratio of merge passes that the sort algorithm has had to do. If this value is high, you should consider increasing the value of sort_buffer_size and read_rnd_buffer_size. A simple ratio calculation is:

Sort passes = sort_merge_passes / (sort_scan + sort_range)

Ratio value lower than 3 should be a good value. If you want to increase the sort_buffer_size or read_rnd_buffer_size, try to increase in small increments until you reach the acceptable ratio.

InnoDB Performance

InnoDB Buffer Pool Hit Rate

Ratio of how often your pages are retrieved from memory instead of disk. If the value is low during early MySQL startup, please allow some time for the buffer pool to warm up. To get the buffer pool hit rate, use the SHOW ENGINE INNODB STATUS statement:

​mysql> SHOW ENGINE INNODB STATUS\G

...

----------------------

BUFFER POOL AND MEMORY

----------------------

...

Buffer pool hit rate 1000 / 1000, young-making rate 0 / 1000 not 0 / 1000

...

The best value is 1000 / 10000 hit rate. For a lower value, for example, the hit rate of 986 / 1000 indicates that out of 1000 page reads, it was able to read pages in RAM 986 times. The remaining 14 times, MySQL had to read the pages data from disk. Simply said, 1000 / 1000 is the best value that we are trying to achieve here, which means the frequently-accessed data fits fully in RAM. 

Increasing the innodb_buffer_pool_size variable will help a lot to accomodate more room for MySQL to work on. However, ensure you have sufficient RAM resources beforehand. Removing redundant indexes could also help. If you have multiple buffer pool instances, make sure the hit rate for every instance reaches 1000 / 1000.

InnoDB Dirty Pages

Ratio of how often InnoDB needs to be flushed. During write-heavy load, it is normal that this percentage increases. 

A simple calculation would be:

InnoDB dirty pages(%) = (innodb_buffer_pool_pages_dirty / innodb_buffer_pool_pages_total) x 100

A good value should be 75% and below. If the percentage of dirty pages stays high for a long time, you may want to increase the buffer pool or get faster disks to avoid performance bottlenecks.

InnoDB Waits for Checkpoint

Ratio of how often InnoDB needs to read or create a page where no clean pages are available. Normally, writes to the InnoDB Buffer Pool happen in the background. However, if it is necessary to read or create a page and no clean pages are available, it is also necessary to wait for pages to be flushed first. The innodb_buffer_pool_wait_free counter counts how many times this has happened. To calculate the ratio of InnoDB wait for checkpointing, we can use the following calculation:

​InnoDB wait for checkpoint = innodb_buffer_pool_wait_free / innodb_buffer_pool_write_requests

If innodb_buffer_pool_wait_free is greater than 0, it is a strong indicator that the InnoDB buffer pool is too small, and operations had to wait on a checkpoint. Increasing the innodb_buffer_pool_size will usually decrease the innodb_buffer_pool_wait_free, as well as this ratio. A good ratio value should stay below 1.

InnoDB Wait for Redolog

Ratio of redo log contention. Check innodb_log_waits and if it continues to increase then increase the innodb_log_buffer_size. It can also mean that the disks are too slow and cannot sustain the disk IO, perhaps due to peak write load. Use the following calculation to calculate the redolog waiting ratio:

​InnoDB wait for redolog = innodb_log_waits / innodb_log_writes

A good ratio value should be below 1. Otherwise, increase the innodb_log_buffer_size.

Tables

Table Cache Usage

The ratio of table cache usage for all threads. A simple calculation would be:

Table cache usage(%) = (opened_tables / table_open_cache) x 100

A good value should be less than 80%. Increase table_open_cache variable until the percentage reaches a good value.

Table Cache Hit Ratio

The ratio of table cache hit usage. A simple calculation would be:

​Table cache hit ratio(%) = (open_tables / opened_tables) x 100

A good hit ratio value should be 90% and above. Otherwise, increase table_open_cache variable until the hit ratio reaches a good value.

Metrics Monitoring with ClusterControl

ClusterControl supports Percona Server for MySQL and it provides an aggregated view of all nodes in a cluster under ClusterControl -> Performance -> DB Status page. This provides a centralized approach to look up for all the status on all hosts with the ability to filter the status, as shown in the following screenshot:

To retrieve the SHOW ENGINE INNODB STATUS output for an individual server, you may use the Performance -> InnoDB Status page, as shown below:

ClusterControl also provides built-in advisors that you can use to track your database performance. This feature is accessible under ClusterControl -> Performance -> Advisors:

Advisors are basically mini-programs executed by ClusterControl in a scheduled timing like cron jobs. You can schedule an advisor by clicking on the "Schedule Advisor" button, and choose any existing advisor from the Developer Studio object tree:

Click on the "Schedule Advisor" button to set the scheduling, argument to pass and also the advisor's tags. You can also compile the advisor to see the output immediately by clicking on the "Compile and run" button, where you should see the following output under the "Messages" underneath it: 

You may create your own advisor by referring to this Developer Guide, written in ClusterControl Domain Specific Language (very similar to Javascript), or customize an existing advisor to suit your monitoring policies. In short, ClusterControl monitoring duty can be extended with unlimited possibilities through ClusterControl Advisors.

How to Secure MySQL: Part One

$
0
0

Whenever application security is mentioned, people think of securing applications against some of the most frequent attacks such as injection, broken authentication, sensitive data exposure, and the like. However, while these attacks are prevalent, knowing how to protect your application from them alone will not be sufficient - especially when you’re running MySQL. Today we are going to look at a different side of security - we are going to look into how to properly secure MySQL.

As MySQL security is a pretty big thing, treat this post as the start of a series of posts regarding MySQL security measures. We will not cover everything, but this post should provide the foundation of some of MySQL’s security measures.

Why Do You Need to Secure MySQL?

First of all, we must answer the question why we would want to secure MySQL. After all, if we secure our application against the most prevalent threats, we should be safe, right? Well, yes and no.

You see, when you secure your application against certain attacks, you make sure that the attackers have a harder time penetrating the defenses of your application - in order to secure your database though, protecting against such attacks will not be sufficient. Securing your database might be the last straw that could save your application (and your database!) from destruction.

How Do I Secure MySQL?

Now, onto the burning question. How do you actually secure MySQL?

When thinking about the security of your MySQL instance(s), you should consider a wide range of possible options. Fortunately, some of those options are not even limited to MySQL meaning that they will be applicable in other scenarios too! We will start with the general things.

MySQL Security - General

When securing MySQL, keep in mind that it uses security-based Access Control Lists (ACLs) for operations performed by users (Access Control Lists are a list of permissions associated with an object). Here’s how to take care of a couple of the most basic security issues:

  • Secure the initial MySQL account - this is very obvious, but you should ensure that the root account has a password. The root account may or may not have a password when MySQL is first installed - you can figure out what the password is by checking the error log, then change it to a stronger one if you wish. All of the other accounts should have passwords too.
  • Never store passwords inside any MySQL databases in plain text - use a one-way hashing function like BCrypt.
  • Do not grant any users access to the user table in the mysql database (the root user is an exception).

Also, familiarize yourself with Access Control and Account Management in MySQL. This subject deserves an entire book in and of itself, but the basic things you should know include:

  • Controlling access in MySQL;
  • Creating, altering, and removing users;
  • Granting and revoking privileges to and from users;
  • Knowing how to check what privileges are assigned;
  • What account categories are;
  • What reserved accounts are;
  • What roles are;
  • How password management works;
  • How account locking works;
  • Taking a glance into the security plugins offered by MySQL;
  • Knowing how to secure MySQL backups.

As far as MySQL security is concerned, backups should also be covered.

Now, we will look into each of these options further.

Controlling Access in MySQL

  • As already noted above, never give any accounts, except the root account, access to the user table in the mysql database;
  • Ensure that all existing MySQL accounts use only the privileges that they absolutely need to perform their actions.

Creating, Altering, and Removing Users in MySQL

In MySQL, users can be created by running the CREATE USER query:

CREATE USER ‘demouser’@’localhost’ IDENTIFIED BY ‘password’;

Users can be altered by running the ALTER USER query - the query allows you to do many different things including locking and unlocking accounts, requiring the account to connect using SSL, establish the maximum amount of connections per hour, discard old passwords, etc. Here’s a sample query that can change your own password:

ALTER USER USER() IDENTIFIED BY ‘password’;

Users can be removed by running the DROP USER query:

DROP USER ‘demouser’@’localhost’;

Granting and Revoking Privileges to and from Users in MySQL

The GRANT statement must grant either privileges or roles. The ON statement is able to tell you whether privileges or roles will be granted. The following query grants privileges:

GRANT ALL ON demo_db.* TO ‘demouser’@’localhost’;

The following query grants roles:

GRANT ‘demo_role’ TO ‘demouser’@’localhost’;

GRANT should respond with Query OK, 0 rows affected.

To revoke certain privileges from users, use the REVOKE statement (the hostname part of the account name defaults to “%”):

REVOKE SELECT ON *.* FROM ‘demouser’@’localhost’;

To revoke all privileges, REVOKE ALL can be used:

REVOKE ALL PRIVILEGES ON *.* FROM ‘demouser’@’localhost’;

You might want to issue a FLUSH PRIVILEGES; statement after performing the steps above.

Checking what Privileges are Assigned in MySQL

  • To check what privileges are assigned, issue the SHOW GRANTS; statement.
  • For every request that is issued, the server determines the operation that you want to perform, then checks whether your privileges are sufficient enough to perform the operation in question.
  • The server uses the user and db tables in the mysql database to ensure access control.
  • The user and global_grants tables grant global privileges.

The rest of the options will be covered in upcoming posts.

Summary

As far as MySQL security is concerned, you have a very wide range of options to choose from. The options include basic security measures that can be applicable to pretty much all applications, but some of the options are pretty specific to MySQL. Keep in mind that not all of the available options have been covered yet - they will be talked about in upcoming editions of the MySQL security series too.

How to Secure MySQL: Part Two

$
0
0

In the previous post about MySQL security, we have covered a range of options that can be used to make your MySQL instance(s) more secure. They included:

  • General MySQL security measures;
  • Controlling access in MySQL;
  • Creating, altering, and deleting users in MySQL;
  • Granting and revoking privileges to and from users in MySQL;
  • Checking what privileges are assigned to users in MySQL.

In this post, we will dive into the rest of the options, including:

  • Account categories in MySQL;
  • Roles in MySQL;
  • Reserved accounts in MySQL;
  • Password management in MySQL;
  • Account locking in MySQL;
  • Security plugins offered by MySQL;
  • Securing MySQL backups.

Keep in mind that once again, we will not cover absolutely everything you need to know, but we will try to provide good starting points to do your own research.

Account Categories in MySQL

Account categories were introduced in MySQL 8 - specifically, in MySQL 8.0.16. Here’s the crux of it:

  • There are two separate account categories: regular users and system users;
  • A regular user is a user without the SYSTEM_USER privilege - a system user is a user with the SYSTEM_USER privilege;
  • A regular user can modify regular accounts - such a user cannot modify system accounts;
  • A system user can modify both system and regular accounts;
  • Regular accounts can be modified by both regular users and system users;
  • System accounts can only be modified by system users.

To make use of account categories in MySQL security-wise, keep in mind that the SYSTEM_USER privilege affects things like account manipulation, and killing sessions and statements within them - this concept in MySQL allows restricting certain modifications to certain accounts thus making MySQL more secure. Account categories can also be used to protect system accounts against manipulation by regular accounts: to do so, do not grant mysql schema modification privileges to regular accounts.

To grant an account SYSTEM_USER privileges, use the following query on a created account:

GRANT SYSTEM_USER ON *.* TO system_user;

Roles in MySQL

In MySQL, roles are collections of privileges. When you grant a user account a role in MySQL, you grant all of the privileges associated with that role. Roles can be created using the CREATE ROLE statement:

CREATE ROLE ‘role_1’, ‘role_2’;

Role names consist of a user part and a host part - the user part cannot be blank and the host part defaults to “%” if it is not specified.

When roles are created, you should assign privileges to them. Privileges can be assigned using the GRANT statement:

  • GRANT ALL ON demo_database.* TO ‘demo_user’; would grant all privileges to a user called demo_user on a database called demo_database;
  • GRANT INSERT, SELECT, UPDATE, DELETE ON database.* TO ‘demo_user’; would grant INSERT, SELECT, UPDATE, and DELETE privileges to a user called demo_user on a database called demo_database;
  • GRANT SELECT ON demo_database.* TO ‘demo_user’; would grant SELECT privileges to a user called demo_user on a database called demo_database.

To assign a role to an individual user, use this syntax:
 

GRANT ‘role_name’ TO ‘user_name’@’localhost’;

To assign multiple roles to an individual user, use this syntax:

GRANT ‘role_1’, ‘role_2’ TO ‘user_name’@’localhost’;

To assign roles to multiple users at the same time, use this syntax:

GRANT ‘role_name’ TO ‘user1’@’localhost’, ‘user2’@’localhost’;

Roles can be helpful in preventing security incidents because if an attacker knows the password of a not very privileged user wrongly assuming the user is very “powerful” role-wise, your application (and your database) could be very well saved.

Reserved Accounts in MySQL

When reserved accounts are concerned, keep in mind that MySQL creates accounts during the data directory initialization. There are a few accounts that should be considered reserved in MySQL:

  • ‘root’@’localhost’ - this account is a superuser account and it has god-like privileges across all MySQL databases (it can perform any operation across any MySQL database). It is worth noting that the root user can also be renamed to avoid exposing a highly privileged account. To rename the account, run the following query:
RENAME USER ‘root’@’localhost’ TO ‘username’@’localhost’;
  • Make sure to issue a FLUSH PRIVILEGES; statement after renaming the account for the changes to take effect.
  • ‘mysql.sys’@’localhost’ - this account is a system user that is used as the definer for view, procedures and functions in the sys schema. Added in MySQL 5.7.9 to avoid issues that might arise if the root account is renamed.
  • ‘mysql.session’@’localhost’ - this account is used internally by plugins to access the server.

In this case, you cannot do very much security-wise, but do keep in mind that the root account has god-like privileges which means that it can perform any operation across any MySQL database and exercise caution when deciding who to grant the privileges to access the account. Also, keep in mind what the other MySQL accounts are used for.

Password Management in MySQL

MySQL also supports password management features. Some of them include:

  • The ability to periodically expire passwords;
  • The ability to avoid password reuse;
  • The ability to generate passwords;
  • The ability to check whether the password in use is strong;
  • The ability to temporarily lock users out after too many failed login attempts.

Now, we will look into these options further.

To expire a password manually, use the ALTER USER statement like so:

ALTER USER ‘user’@’localhost’ PASSWORD EXPIRE;

To set a global policy, modify the my.cnf file such that it includes the default_password_lifetime parameter. The parameter can be defined beneath the [mysqld] section (the following example sets the password lifetime to 3 months (90 days)):

default_password_lifetime=90

If you want the passwords to never expire, set the parameter default_password_litetime to 0.
You can also set password expiration for specific users. If you would want to set the interval of password expiration for a user called demo_user, you could use the following example:

ALTER USER ‘demo_user’@’localhost’ PASSWORD EXPIRE INTERVAL 90 DAY;

To disable password expiration:

ALTER USER ‘demo_user’@’localhost’ PASSWORD EXPIRE NEVER;

To reset the global password expiration policy:

ALTER USER ‘demo_user’@’localhost’ PASSWORD EXPIRE DEFAULT;

​​Password reuse restrictions do not allow passwords to be reused - to make use of this feature, use the password_history and password_reuse_interval variables. You can either put these variables in my.cnf by looking at the example below or set them at runtime by adding SET PERSIST in front of the statements below.

To prohibit reuse of any of the 5 previously used passwords newer than 365 days, use:

password_history=5
password_reuse_interval=365

To require a minimum of 5 password changes before allowing reuse:

ALTER USER ‘demo_user’@’localhost’ PASSWORD HISTORY 5;

The same can be done when creating a user - replace ALTER USER with CREATE USER.

To generate a random password when creating a user, run:

CREATE USER demo_user@localhost IDENTIFIED BY RANDOM PASSWORD;

To change the password of a user to a randomly generated one:

SET PASSWORD FOR demo_user@localhost TO RANDOM;

Your random password will be displayed underneath.

Keep in mind that the default random passwords have a length of 20 characters. The length can be controlled by the generated_random_password_length variable which has a range from 5 to 255.

To check whether a used password is strong, you can use the VALIDATE_PASSWORD_STRENGTH variable - the function displays a number from 0 to 100 with 0 being the weakest and 100 being the strongest:
SELECT VALIDATE_PASSWORD_STRENGTH(‘password’);

Account Locking in MySQL

MySQL 8.0.19 also introduced the ability to temporarily lock user accounts. This can be accomplished using the variables FAILED_LOGIN_ATTEMPTS and PASSWORD_LOCK_TIME.

To enable account locking when creating a user, run:

CREATE USER ‘demo_user’@’localhost’ IDENTIFIED BY ‘password’ FAILED_LOGIN_ATTEMPTS 5 PASSWORD_LOCK_TIME 5;

The value after FAILED_LOGIN_ATTEMPTS specifies after how many failed attempts the account is locked, the value after PASSWORD_LOCK_TIME specifies the account lock time in days. It is also possible to specify a value which does not end until the account is unlocked by specifying PASSWORD_LOCK_TIME as UNBOUNDED.

Security Plugins Offered by MySQL

MySQL also offers a couple of plugins that can further enhance security capabilities. MySQL offers:

  • Authentication plugins;
  • Connection-control plugins;
  • Password validation plugins;
  • Audit plugins;
  • Firewall plugins;

These plugins can be used for a number of things security-wise:

Authentication Plugins

Authentication plugins can allow users to choose between multiple pluggable authentication methods available in MySQL. They can be used together with CREATE USER or ALTER USER statements. Here’s an example: 

CREATE USER ‘user_1’@’localhost’ IDENTIFIED WITH mysql_native_password BY ‘password’;

This query would implement authentication using the native password hashing method.

Connection-Control Plugins

Connection-control plugins can introduce an increasing delay in server responses to connection attempts if the connection attempts exceed a certain number - they are able to stop potential brute-force attacks. This plugin library was introduced to MySQL in the version 5.7.17 and it can be added to MySQL either via my.cnf or by loading the plugins into the server at runtime.
In order to add the plugins to my.cnf, add the following line beneath [mysqld]:

plugin-load-add=connection_control.so

After modifying the file, save your changes and restart MySQL.
In order to load the plugins into the server at runtime, run:

INSTALL PLUGIN CONNECTION_CONTROL SONAME ‘connection_control.so’;
INSTALL PLUGIN CONNECTION_CONTROL_FAILED_LOGIN_ATTEMPTS SONAME ‘connection_control.so’;

Adjust the .so suffix as necessary. If you’ve accomplished everything correctly, the CONNECTION_CONTROL_FAILED_LOGIN_ATTEMPTS table should contain all of the failed attempts to connect.

Password Validation Plugins

Password validation plugins can allow users to use stronger passwords if used properly. The password validation plugin can be installed via my.cnf or by loading the plugin into the server at runtime. To install the plugin via my.cnf, add the following line underneath [mysqld], then restart the server:

plugin-load-add=validate_password.so

To load the plugin at runtime, run the following statement:

INSTALL PLUGIN validate_password SONAME ‘validate_password.so’;

To load the plugin at runtime and prevent it from being removed, add validate-password=FORCE_PLUS_PERMANENT to my.cnf.

To prevent the server from running if the plugin is not initialized, use the --validate-password option with a value of FORCE or FORCE_PLUS_PERMANENT.

The password strength policy can also be changed: to do so, change the validate_password_policy value to LOW, MEDIUM, or STRONG. The value of LOW checks only password length, MEDIUM policy adds some conditions and STRONG policy adds the condition that password substrings that consist of 4 or more characters must not match words in a dictionary file that can be specified by modifying the validate_password_dictionary_file variable.

Keyring Plugins

Keyring plugins can enable server components and plugins to securely store sensitive information for retrieval. To load the plugin into MySQL, add the following underneath [mysqld]:

early-plugin-load=keyring_file.so

To specify the keyring vault file, add the following (the keyring_vault_config variable should point to the configuration file):

loose-keyring_vault_config=”/var/lib/mysql_keyring/keyring_vault.conf”

The keyring file should contain the vault_url variable which defines the vault server address, the secret_mount_point variable which defines the mount point name where the keyring vault stores the keys, and a token which should be defined by the vault server. Optionally, the vault_ca variable can also be defined (it should point to the CA certificate used to sign the vault’s certificates).

Restart the server for the changes to take effect;

Audit Plugins

Audit plugins can enable monitoring, logging, and blocking of activity performed on MySQL servers. To install MySQL Enterprise Audit, run a script located in the share directory of your MySQL instance (avoid putting your MySQL instance password in the terminal - use my.cnf):

mysql < /path/to/audit_log_filter_linux_install.sql

You can also prevent the plugin from being removed at runtime - add the following in the [mysqld] section:

audit_log=FORCE_PLUS_PERMANENT

Restart the server to apply the changes. Do note that the rule-based logging logs no auditable events by default, so to make it log everything, create a filter:

SELECT audit_log_filter_set_filter(‘log_filter’, ‘{ “filter”: { “log”: true } }’);

Then assign it to an account:

SELECT audit_log_filter_set_user(‘%’, ‘log_filter’);

Note that audit plugins are only available in MySQL Enterprise Edition;

Firewall Plugins

Firewall plugins can enable users to permit or deny the execution of specific SQL statements based on specific patterns. MySQL Enterprise Firewall was introduced in MySQL 5.6.24 - it is able to protect data by monitoring, alerting, and blocking unauthorized activity: it is able to block SQL injection attacks, monitor threats, and block suspicious traffic as well as to detect intrusions into the database. The firewall is also able to log blocked statements - they can be inspected and a real-time count of approved and rejected statements can also be observed.

To install MySQL Enterprise Firewall, simply enable it when installing MySQL Server on Windows, it can also be installed, disabled, or uninstalled with the help of MySQL Workbench 6.3.4. The firewall can also be installed manually by running a script in the share directory of your MySQL installation. To enable the firewall, add the following line underneath [mysqld] and restart the server:

mysql_firewall_mode=ON

The firewall can also be enabled at runtime:

SET GLOBAL mysql_firewall_mode = ON;

Alternatively, to persist the firewall (meaning that the firewall will not have to be re-enabled on each subsequent server restart):

SET PERSIST mysql_firewall_mode = ON;

Then, grant a FIREWALL_ADMIN privilege to any account that administers the firewall and the FIREWALL_USER privilege to any account that should only have access to its own firewall rules. Also,  grant the EXECUTE privilege for the stored procedures of the firewall in the mysql database. In order for the firewall to function, register profiles with it, then train the firewall to know the allowed statements that the database can execute and afterwards tell the firewall to match incoming statements against the set whitelist. Each profile has an operational mode - OFF, RECORDING, PROTECTING or DETECTING. OFF disables the profile, RECORDING trains the firewall, PROTECTING allows or denies statement execution and DETECTING detects (but does not block) intrusion attempts. Rules for a specified profile can be reset by setting its value to RESET. OFF will disable the profile. To set the mode, use the following query where name is the profile name and OFF is the operational mode: 

CALL mysql.sp_set_firewall_mode(name, ‘OFF’);

The firewall plugin is also only available in MySQL Enterprise Edition.

Securing MySQL Backups

As far as MySQL backups are concerned, you have a couple of options.

  • If you’re using mysqldump, you can store your username and password in my.cnf and invoke mysqldump like so (the following command will dump all databases into a file /home/backup.sql):
$ mysqldump --defaults-extra-file=/var/lib/my.cnf --single-transaction --all-databases > /home/backup.sql
  • By storing your username and password inside of my.cnf, you do not write your password inside the terminal - such a method for taking backups is more secure because while the dump is running the command can be seen via the ps ax command.
  • You can also consider using mysqldump-secure which is a POSIX-compliant wrapper script which is capable of compressing and encrypting backups with strong security in mind.

  • Backups can be encrypted by using OpenSSL - simply take your backup, then encrypt it with the following command:

    $ openssl enc -aes-256-cbc -salt -in backup.tar.gz -out backup.tar.gz.enc -k password

    The command above will create a new encrypted file backup.tar.gz.enc in the current directory. The file will be encrypted with the password you chose (replace password with your desired password). The file can be decrypted later by running the following command:

    $ openssl aes-256-cbc -d -in backup.tar.gz.enc -out backup.tar.gz -k password

    Replace password with your password.

  • mysqldumphas another option to encrypt your backups (the following example also compresses them with gzip):

    $ mysqldump --all-databases --single-transaction --triggers --routines | gzip | openssl  enc -aes-256-cbc -k password > backup.xb.enc

    Replace password with your desired password.

  • You can also encrypt your backups using mariabackup or xtrabackup. Here’s an example from the MariaDB documentation:

    $ mariabackup --user=root --backup --stream=xbstream  | openssl  enc -aes-256-cbc -k password > backup.xb.enc

    Replace password with your desired password.

  • Backups can also be encrypted using ClusterControl - if the encryption option is enabled for a particular backup, ClusterControl will encrypt the backup using AES-256 CBC (encryption happens on the backup node). If the backup is stored on a controller node, the backup files are streamed in an encrypted format using socat or netcat. If compression is enabled, ClusterControl will first compress the backup, after that - encrypt it. The encryption key will be generated automatically if it does not exist, then stored inside CMON configuration in the backup_encryption_key option. Keep in mind that this key is encoded and should be decoded first. To do so, run the following command:

    $ cat /etc/cmon.d/cmon_ClusterID.cnf | grep ^backup_encryption_key | cut -d"'" -f2 | base64 -d > keyfile.key

    The command will read the backup_encryption_key and decode its value to a binary output. The keyfile can be used to decrypt the backup like so:

    $ cat backup.aes256 | openssl enc -d -aes-256-cbc -pass file:/path/to/keyfile.key > backup_file.xbstream.gz

    For more examples, check the ClusterControl documentation.

Conclusion

In these posts about MySQL security we covered some security measures that can be of good use if you feel the need to tighten the security of your MySQL instance(s). While we did not cover absolutely everything, we feel that these points can be a good starting point when tightening the security of your MySQL installation. Take from these posts what you will, do your own research, and apply the security measures most applicable in your situation.

An Overview of ProxySQL Clustering in ClusterControl

$
0
0

ProxySQL is a well known load balancer in MySQL world - it comes with a great set of features that allow you to take control over your traffic and shape it however you see it fit. It can be deployed in many different ways - dedicated nodes, collocated with application hosts, silo approach - all depends on the exact environment and business requirements. The common challenge is that you, most of the cases, want your ProxySQL nodes to contain the same configuration. If you scale out your cluster and add a new server to ProxySQL, you want that server to be visible on all ProxySQL instances, not just on the active one. This leads to the question - how to make sure you keep the configuration in sync across all ProxySQL nodes?

You can try to update all nodes by hand, which is definitely not efficient. You can also use some sort of infrastructure orchestration tools like Ansible or Chef to keep the configuration across the nodes in a known state, making the modifications not on ProxySQL directly but through the tool you use to organize your environment.

If you happen to use ClusterControl, it comes with a set of features that allow you to synchronize the configuration between ProxySQL instances but this solution has its cons - it is a manual action, you have to remember to execute it after a configuration change. If you forget to do that, you may be up to a nasty surprise if, for example, keepalived will move Virtual IP to the non-updated ProxySQL instance.

None of those methods is simple or 100% reliable and the situation is when the ProxySQL nodes have different configurations and might be potentially dangerous.

Luckily, ProxySQL comes with a solution for this problem - ProxySQL Cluster. The idea is fairly simple - you can define a list of ProxySQL instances that will talk to each other and inform others about the version of the configuration that each of them contains. Configuration is versioned therefore any modification of any setting on any node will result in the configuration version being increased - this triggers the configuration synchronization and the new version of the configuration is distributed and applied across all nodes that form the ProxySQL cluster.

The recent version of ClusterControl allows you to set up ProxySQL clusters effortlessly. When deploying ProxySQL you should tick the “Use Native Clustering” option for all of the nodes you want to be part of the cluster.

Once you do that, you are pretty much done - the rest happens under the hood.

MySQL [(none)]> select * from proxysql_servers;

+------------+------+--------+----------------+

| hostname   | port | weight | comment        |

+------------+------+--------+----------------+

| 10.0.0.131 | 6032 | 0      | proxysql_group |

| 10.0.0.132 | 6032 | 0      | proxysql_group |

+------------+------+--------+----------------+

2 rows in set (0.001 sec)

On both of the servers the proxysql_servers table was set properly with the hostnames of the nodes that form the cluster. We can also verify that the configuration changes are properly propagated across the cluster:

We have increased the Max Connections setting on one of the ProxySQL nodes (10.0.0.131) and we can verify that the other node (10.0.0.132) will see the same configuration:

In case of a need to debug the process, we can always look to the ProxySQL log (typically located in /var/lib/proxysql/proxysql.log) where we will see information like this:

2020-11-26 13:40:47 [INFO] Cluster: detected a new checksum for mysql_servers from peer 10.0.0.131:6032, version 11, epoch 1606398059, checksum 0x441378E48BB01C61 . Not syncing yet ...

2020-11-26 13:40:49 [INFO] Cluster: detected a peer 10.0.0.131:6032 with mysql_servers version 12, epoch 1606398060, diff_check 3. Own version: 9, epoch: 1606398022. Proceeding with remote sync

2020-11-26 13:40:50 [INFO] Cluster: detected a peer 10.0.0.131:6032 with mysql_servers version 12, epoch 1606398060, diff_check 4. Own version: 9, epoch: 1606398022. Proceeding with remote sync

2020-11-26 13:40:50 [INFO] Cluster: detected peer 10.0.0.131:6032 with mysql_servers version 12, epoch 1606398060

2020-11-26 13:40:50 [INFO] Cluster: Fetching MySQL Servers from peer 10.0.0.131:6032 started. Expected checksum 0x441378E48BB01C61

2020-11-26 13:40:50 [INFO] Cluster: Fetching MySQL Servers from peer 10.0.0.131:6032 completed

2020-11-26 13:40:50 [INFO] Cluster: Fetching checksum for MySQL Servers from peer 10.0.0.131:6032 before proceessing

2020-11-26 13:40:50 [INFO] Cluster: Fetching checksum for MySQL Servers from peer 10.0.0.131:6032 successful. Checksum: 0x441378E48BB01C61

2020-11-26 13:40:50 [INFO] Cluster: Writing mysql_servers table

2020-11-26 13:40:50 [INFO] Cluster: Writing mysql_replication_hostgroups table

2020-11-26 13:40:50 [INFO] Cluster: Loading to runtime MySQL Servers from peer 10.0.0.131:6032

This is the log from 10.0.0.132 where we can clearly see that a configuration change for table mysql_servers was detected on 10.0.0.131 and then it was synced and applied on 10.0.0.132, making it in sync with the other node in the cluster.

As you can see, clustering ProxySQL is an easy yet efficient way to ensure its configuration stays in sync and helps significantly to use larger ProxySQL deployments. Let us know down in the comments what your experience with ProxySQL clustering is.

Viewing all 568 articles
Browse latest View live