Quantcast
Channel: Severalnines - MySQL
Viewing all 568 articles
Browse latest View live

MySQL Performance Cheat Sheet

$
0
0

MySQL is extensive and has lots of areas to optimize and tweak for the desired performance. Some changes can be performed dynamically, others require a server restart. It is pretty common to find a MySQL installation with a default configuration, although the latter may not be appropriate per se from your workload and setup.

Here are the key areas in MySQL which I have taken from different expert sources in the MySQL world, as well as our own experiences here at Severalnines. This blog would serve as your cheat sheet to tune performance and make your MySQL great again :-)

Let’s take a look on these by outlining the key areas in MySQL.

System Variables

MySQL has lots of variables that you can consider to change. Some variables are dynamic which means they can be set using the SET statement. Others require a server restart, after they are set in the configuration file (e.g. /etc/my.cnf, etc/mysql/my.cnf). However, I’ll go over the common things that are pretty common to tune to make the server optimized.

sort_buffer_size

This variable controls how large your filesort buffer is, which means that whenever a query needs to sort the rows, the value of this variable is used to limit the size that needs to be allocated. Take note that this variable is per-query that is processed (or per-connection) basis, which means that it would be a memory hungry when you set this higher and if you have multiple connections that requires sorting of your rows. However, you can monitor your needs by checking the global status variable Sort_merge_passes. If this value is large, you should consider increasing the value of the sort_buffer_size system variable. Otherwise, take it to the moderate limit that you need. If you set this too low or if you have large queries to process, the effect of sorting your rows can be slower than expected because data is retrieved randomly doing disk dives. This can cause performance degradation. However, it is best to fix your queries. Otherwise, if your application is designed to pull large queries and requires sorting, then it is efficient to use tools that handles query caching like Redis. By default, in MySQL 8.0, the current value set is 256 KiB. Set this accordingly only when you have queries that are heavily using or calling sorts.

read_buffer_size

MySQL documentation mentions that for each request that performs a sequential scan of a table, it allocates a read buffer. The read_buffer_size system variable determines the buffer size. It is also useful for MyISAM, but this variable affects all storage engines as well. For MEMORY tables, it is use to determine the memory block size.

Basically, each thread that does a sequential scan for a MyISAM table allocates a buffer of this size (in bytes) for each table it scans. It does applies for all storage engines (that includes InnoDB) as well, so it’s helpful for queries that are sorting rows using ORDER BY and caching its indexes in a temporary file. If you do many sequential scans, bulk insert into partition tables, caching results of nested queries, then consider increasing its value. The value of this variable should be a multiple of 4KB. If it is set to a value that is not a multiple of 4KB, its value will be rounded down to the nearest multiple of 4KB. Take into account that setting this to a higher value will consume a large chunk of your server’s memory. I suggest not to use this without proper benchmarking and monitoring of your environment.

read_rnd_buffer_size

This variable deals with reading rows from a MyISAM table in sorted order following a key-sorting operation, the rows are read through this buffer to avoid disk seeks. The documentation says, when reading rows in an arbitrary sequence or from a MyISAM table in sorted order following a key-sorting operation, the rows are read through this buffer (and determined through this buffer size) to avoid disk seeks. Setting the variable to a large value can improve ORDER BY performance by quite a lot. However, this is a buffer allocated for each client, so you should not set the global variable to a large value. Instead, change the session variable only from within those clients that need to run large queries. However, you should take into account that this does not apply to MariaDB, especially when taking advantage of MRR. MariaDB uses mrr_buffer_size while MySQL uses read_buffer_size read_rnd_buffer_size.

join_buffer_size

By default, value is of 256K. The minimum size of the buffer that is used for plain index scans, range index scans, and joins that do not use indexes and thus perform full table scans. Also used by the BKA optimization (which is disabled by default). Increase its value to get faster full joins when adding indexes is not possible. Caveat though might be memory issues if you set this too high. Remember that one join buffer is allocated for each full join between two tables. For a complex join between several tables for which indexes are not used, multiple join buffers might be necessary. Best left low globally and set high in sessions (by using SET SESSION syntax) that require large full joins. In 64-bit platforms, Windows truncates values above 4GB to 4GB-1 with a warning.

max_heap_table_size

This is the maximum size in bytes for user-created MEMORY tables are permitted to grow. This is helpful when your application is dealing with MEMORY storage engine tables. Setting the variable while the server is active has no effect on existing tables unless they are recreated or altered. The smaller of max_heap_table_size and tmp_table_size also limits internal in-memory tables. This variable is also in conjunction with tmp_table_size to limit the size of internal in-memory tables (this differs from the tables created explicitly as Engine=MEMORY as it only applies max_heap_table_size), whichever is smaller is applied between the two.

tmp_table_size

The largest size for temporary tables in-memory (not MEMORY tables) although if max_heap_table_size is smaller the lower limit will apply. If an in-memory temporary table exceeds the limit, MySQL automatically converts it to an on-disk temporary table. Increase the value of tmp_table_size (and max_heap_table_size if necessary) if you do many advanced GROUP BY queries and you have large available memory space. You can compare the number of internal on-disk temporary tables created to the total number of internal temporary tables created by comparing the values of the Created_tmp_disk_tables and Created_tmp_tables variables. In ClusterControl, you can monitor this via Dashboard -> Temporary Objects graph.
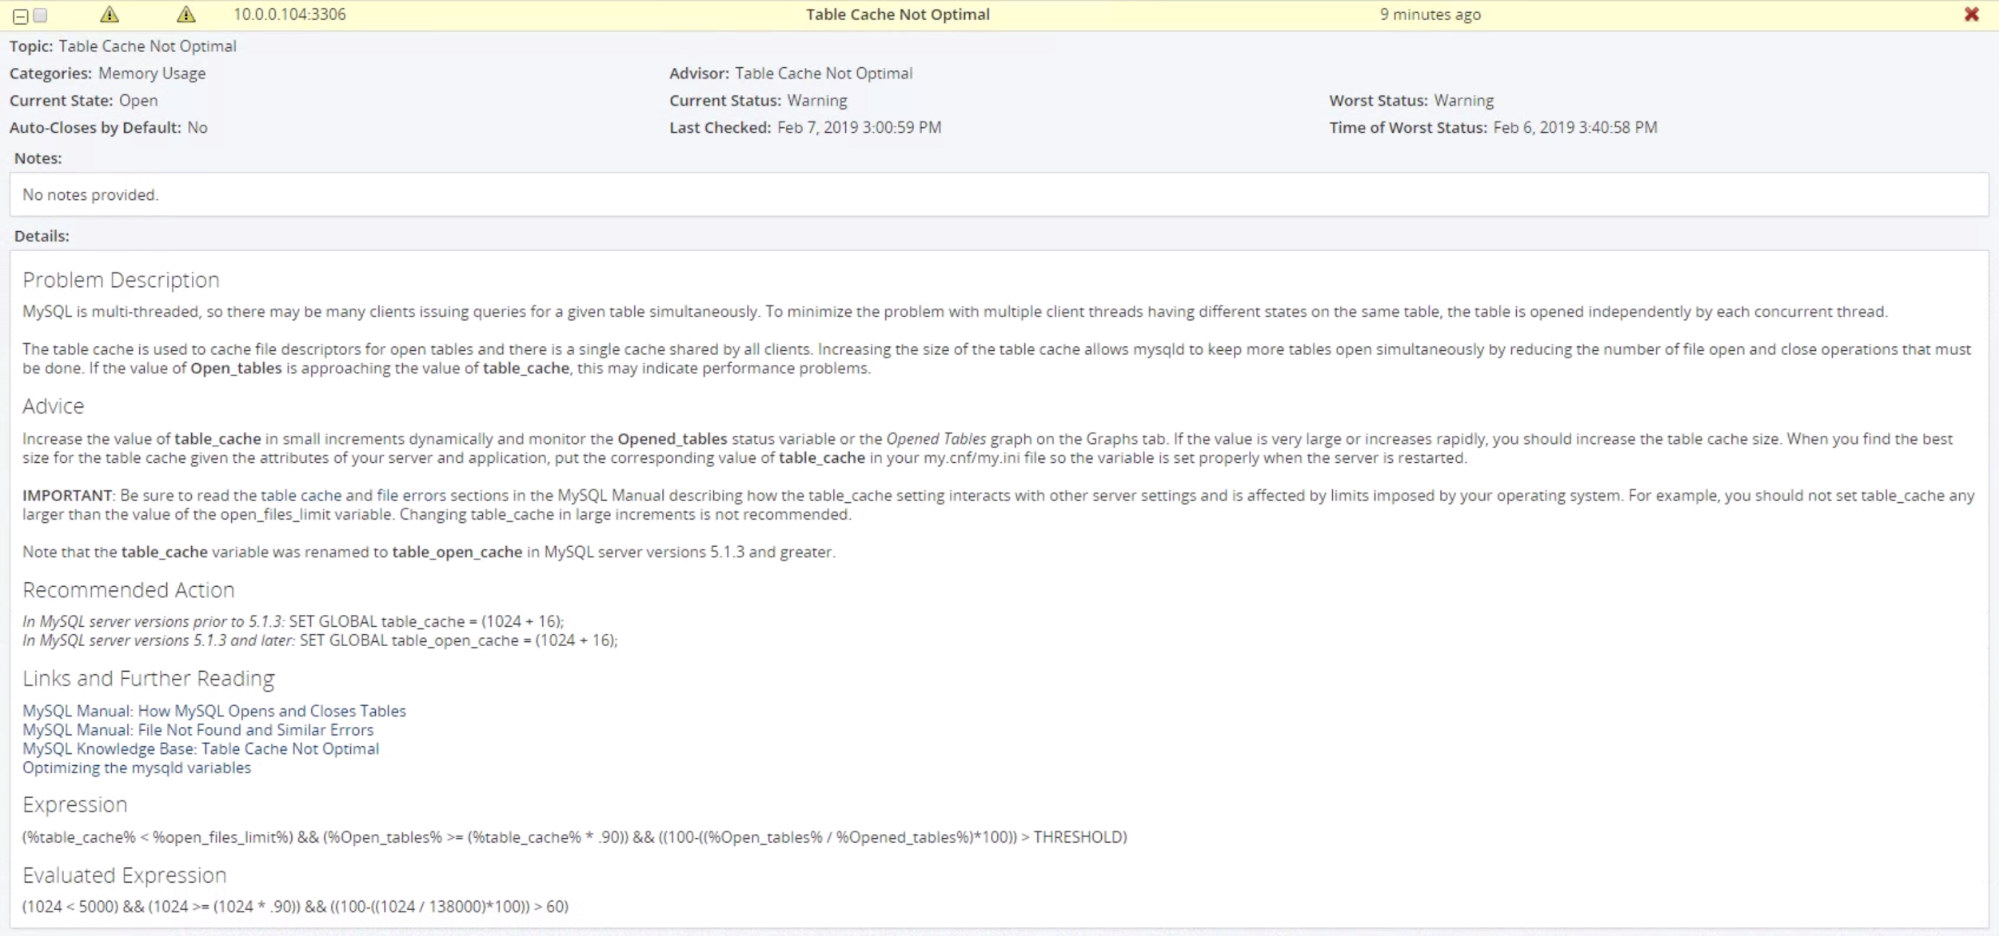
table_open_cache

You can increase the value of this variable if you have large number of tables that are frequently accessed in your data set. It will be applied for all threads, meaning per connection basis. The value indicates the maximum number of tables the server can keep open in any one table cache instance. Although increasing this value increases the number of file descriptors that mysqld requires, so you might as well consider checking your open_files_limit value or check how large is the SOFT and HARD limit set in your *nix operating system. You can monitor this whether you need to increase the table cache by checking the Opened_tables status variable. If the value of Opened_tables is large and you do not use FLUSH TABLES often (which just forces all tables to be closed and reopened), then you should increase the value of the table_open_cache variable. If you have a small value for table_open_cache, and a high number of tables are frequently accessed, this can affect the performance of your server. If you notice many entries in the MySQL processlistwith status “Opening tables” or “Closing tables”, then it’s time to adjust the value of this variable but take note of the caveat mentioned earlier. In ClusterControl, you can check this under Dashboards -> Table Open Cache Status or Dashboards -> Open Tables. You can check it here for more info.

table_open_cache_instances

Setting this variable would help improve scalability, and of course, performance which would reduce contention among sessions. The value you set here limits the number of open tables cache instances. The open tables cache can be partitioned into several smaller cache instances of size table_open_cache / table_open_cache_instances . A session needs to lock only one instance to access it for DML statements. This segments cache access among instances, permitting higher performance for operations that use the cache when there are many sessions accessing tables. (DDL statements still require a lock on the entire cache, but such statements are much less frequent than DML statements.) A value of 8 or 16 is recommended on systems that routinely use 16 or more cores.

table_definition_cache

Cache table definitions i.e. this is where the CREATE TABLE are cached to speed up opening of tables and only one entry per table. It would be reasonable to increase the value if you have large number of tables. The table definition cache takes less space and does not use file descriptors, unlike the normal table cache. Peter Zaitsev of Percona suggest if you can try the setting of the formula below,

The number of user-defined tables + 10% unless 50K+ tables

But take note that the default value is based on the following formula capped to a limit of 2000.

MIN(400 + table_open_cache / 2, 2000)

So in case you have larger number of tables compared to the default, then it’s reasonable you increase its value. Take into account that with InnoDB, this variable is used as a soft limit of the number of open table instances for the data dictionary cache. It will apply the LRU mechanism once it exceeds the current value of this variable. The limit helps address situations in which significant amounts of memory would be used to cache rarely used table instances until the next server restart. Hence, parent and child table instances with foreign key relationships are not placed on the LRU list and could impose a higher than the limit defined by table_definition_cache and are not subject to eviction in memory during LRU. Additionally, the table_definition_cache defines a soft limit for the number of InnoDB file-per-table tablespaces that can be open at one time, which is also controlled by innodb_open_files and in fact, the highest setting between these variables is used, if both are set. If neither variable is set, table_definition_cache, which has a higher default value, is used. If the number of open tablespace file handles exceeds the limit defined by table_definition_cache or innodb_open_files, the LRU mechanism searches the tablespace file LRU list for files that are fully flushed and are not currently being extended. This process is performed each time a new tablespace is opened. If there are no “inactive” tablespaces, no tablespace files are closed. So keep this in mind.

max_allowed_packet

This is the per-connection maximum size of an SQL query or row returned. The value was last increased in MySQL 5.6. However in MySQL 8.0 (at least on 8.0.3), the current default value is 64 MiB. You might consider adjusting this if you have large BLOB rows that need to be pulled out (or read), otherwise you can leave this default settings with 8.0 but in older versions, default is 4 MiB so you might take care of that in case you encounter ER_NET_PACKET_TOO_LARGE error. The largest possible packet that can be transmitted to or from a MySQL 8.0 server or client is 1GB.

ClusterControl
Single Console for Your Entire Database Infrastructure
Find out what else is new in ClusterControl

skip_name_resolve

MySQL server handles incoming connections by hostname resolution. By default, MySQL does not disable any hostname resolution which means it will perform a DNS lookups, and by chance, if DNS is slow, it could be the cause of awful performance to your database. Consider turning this on if you do not need DNS resolution and take advantage of improving your MySQL performance when this DNS lookup is disabled. Take into account that this variable is not dynamic, therefore a server restart is required if you set this in your MySQL config file. You may optionally start mysqld daemon, passing --skip-name-resolve option to enable this.

max_connections

This is the number of permitted connections for your MySQL server. If you find out the error in MySQL ‘Too many connections’, you might consider setting it higher. By default, the value of 151 isn’t enough especially on a production database, and considering that you have greater resources of the server (do not waste your server resources especially if it’s a dedicated MySQL server). However, you must have enough file descriptors otherwise you will run out of them. In that case, consider adjusting your SOFT and HARD limit of your *nix operating systems and set a higher value of open_files_limit in MySQL (5000 is the default limit). Take into account that it is very frequent that the application does not close connections to the database correctly, and setting a high max_connections can result to some unresponsive or high load of your server. Using a connection pool at the application level can help resolve the issue here.

thread_cache_size

This is the cache to prevent excessive thread creation. When a client disconnects, the client's threads are put in the cache if there are fewer than thread_cache_size threads there. Requests for threads are satisfied by reusing threads taken from the cache if possible, and only when the cache is empty is a new thread created. This variable can be increased to improve performance if you have a lot of new connections. Normally, this does not provide a notable performance improvement if you have a good thread implementation. However, if your server sees hundreds of connections per second you should normally set thread_cache_size high enough so that most new connections use cached threads. By examining the difference between the Connections and Threads_created status variables, you can see how efficient the thread cache is. Using the formula stated in the documentation, 8 + (max_connections / 100) is good enough.

query_cache_size

For some setup, this variable is their worst enemy. For some systems experiencing high load and are busy with high reads, this variable will bog you down. There has been benchmarks that were well-and-tested by e.g., Percona. This variable must be set to 0 along with query_cache_type = 0 as well to turn it off. The good news in MySQL 8.0 is that, the MySQL Team has stopped supporting this, as this variable can really cause performance issues. I have to agree on their blog that it is unlikely to improve predictability of performance. If you are engaged to use query caching, I suggest to use Redis or ProxySQL.

Storage Engine - InnoDB

InnoDB is an ACID-compliant storage engine with various features to offer along with foreign key support (Declarative Referential Integrity). This has a lot of things to say here but certain variables to consider for tuning:

innodb_buffer_pool_size

This variable acts like a key buffer of MyISAM but it has lots of things to offer. Since InnoDB relies heavily on the buffer pool, you would consider setting this value typically to 70%-80% of your server’s memory. It is favorable also that you have a larger memory space than your data set, and setting a higher value for your buffer pool but not by too much. In ClusterControl, this can be monitored using our Dashboards -> InnoDB Metrics -> InnoDB Buffer Pool Pages graph. You may also monitor this with SHOW GLOBAL STATUS using the variables Innodb_buffer_pool_pages*.

innodb_buffer_pool_instances

For your concurrency workload, setting this variable can improve concurrency and reduce contention as different threads of read/write to cached pages. Minimum innodb_buffer_pool_instances should be lie between 1 (minimum) & 64 (maximum). Each page that is stored in or read from the buffer pool is assigned to one of the buffer pool instances randomly, using a hashing function. Each buffer pool manages its own free lists, flush lists, LRUs, and all other data structures connected to a buffer pool, and is protected by its own buffer pool mutex. Take note that this option takes effect only when innodb_buffer_pool_size >= 1GiB and its size is divided among the buffer pool instances.

innodb_log_file_size

This variable is the log file in a log group. The combined size of log files (innodb_log_file_size * innodb_log_files_in_group) cannot exceed a maximum value that is slightly less than 512GB. According to Vadim, a bigger log file size is better for performance, but it has a drawback (a significant one) that you need to worry about: the recovery time after a crash. You need to balance recovery time in the rare event of a crash recovery versus maximizing throughput during peak operations. This limitation can translate to a 20x longer crash recovery process!

To elaborate it, a larger value would be good for InnoDB transaction logs and are crucial for good and stable write performance. The larger the value, the less checkpoint flush activity is required in the buffer pool, saving disk I/O. However, the recovery process is pretty slow once your database was abnormally shutdown (crash or killed, either OOM or accidental). Ideally, you can have 1-2GiB in production but of course you can adjust this. Benchmarking this changes can be a great advantage to see how it performs especially during after a crash.

innodb_log_buffer_size

To save disk I/O, InnoDB’s writes the change data into lt’s log buffer and it uses the value of innodb_log_buffer_size having a default value of 8MiB. This is beneficial especially for large transactions as it does not need to write the log of changes to disk before transaction commit. If your write traffic is too high (inserts, deletes, updates), making the buffer larger saves disk I/O.

innodb_flush_log_at_trx_commit

When innodb_flush_log_at_trx_commit is set to 1 the log buffer is flushed on every transaction commit to the log file on disk and provides maximum data integrity but it also has performance impact. Setting it to 2 means log buffer is flushed to OS file cache on every transaction commit. The implication of 2 is optimal and improves performance if you can relax your ACID requirements, and can afford to lose transactions for the last second or two in case of OS crashes.

innodb_thread_concurrency

With improvements to the InnoDB engine, it is recommended to allow the engine to control the concurrency by keeping it to default value (which is zero). If you see concurrency issues, you can tune this variable. A recommended value is 2 times the number of CPUs plus the number of disks. It’s dynamic variable means it can set without restarting MySQL server.

innodb_flush_method

This variable though must be tried and tested on which hardware fits you best. If you are using a RAID with battery-backed cache, DIRECT_IO helps relieve I/O pressure. Direct I/O is not cached so it avoids double buffering with buffer pool and filesystem cache. If your disk is stored in SAN, O_DSYNC might be faster for a read-heavy workload with mostly SELECT statements.

innodb_file_per_table

innodb_file_per_table is ON by default from MySQL 5.6. This is usually recommended as it avoids having a huge shared tablespace and as it allows you to reclaim space when you drop or truncate a table. Separate tablespace also benefits for Xtrabackup partial backup scheme.

innodb_stats_on_metadata

This attempts to keep the percentage of dirty pages under control, and before the Innodb plugin, this was really the only way to tune dirty buffer flushing. However, I have seen servers with 3% dirty buffers and they are hitting their max checkpoint age. The way this increases dirty buffer flushing also doesn’t scale well on high io subsystems, it effectively just doubles the dirty buffer flushing per second when the % dirty pages exceeds this amount.

innodb_io_capacity

This setting, in spite of all our grand hopes that it would allow Innodb to make better use of our IO in all operations, simply controls the amount of dirty page flushing per second (and other background tasks like read-ahead). Make this bigger, you flush more per second. This does not adapt, it simply does that many iops every second if there are dirty buffers to flush. It will effectively eliminate any optimization of IO consolidation if you have a low enough write workload (that is, dirty pages get flushed almost immediately, we might be better off without a transaction log in this case). It also can quickly starve data reads and writes to the transaction log if you set this too high.

innodb_write_io_threads

Controls how many threads will have writes in progress to the disk. I’m not sure why this is still useful if you can use Linux native AIO. These can also be rendered useless by filesystems that don’t allow parallel writing to the same file by more than one thread (particularly if you have relatively few tables and/or use the global tablespaces)

innodb_adaptive_flushing

Specifies whether to dynamically adjust the rate of flushing dirty pages in the InnoDB buffer pool based on the workload. Adjusting the flush rate dynamically is intended to avoid bursts of I/O activity. Typically, this is enabled by default . This variable, when enabled, tries to be smarter about flushing more aggressively based on the number of dirty pages and the rate of transaction log growth.

innodb_dedicated_server

This variable is new in MySQL 8.0 which is applied globally and requires a MySQL restart since it’s not a dynamic variable. However, as documentation states that this variable is desired to be enabled only if your MySQL is running on a dedicated server. Otherwise, do not enable this on a shared host or shares system resources with other applications. When this is enabled, InnoDB will do an automatic configuration for the amount of memory detected for variables innodb_buffer_pool_size, innodb_log_file_size, innodb_flush_method. The downside only is that you cannot have the feasibility to apply your desired values on the detected variables mentioned.

MyISAM

key_buffer_size

InnoDB is the default storage engine now of MySQL, the default for key_buffer_size can probably be decreased unless you are using MyISAM productively as part of your application (but who uses MyISAM in production now?). I would suggest here to set perhaps 1% of RAM or 256 MiB at start if you have larger memory and dedicate the remaining memory for your OS cache and InnoDB buffer pool.

Other Provisions For Performance
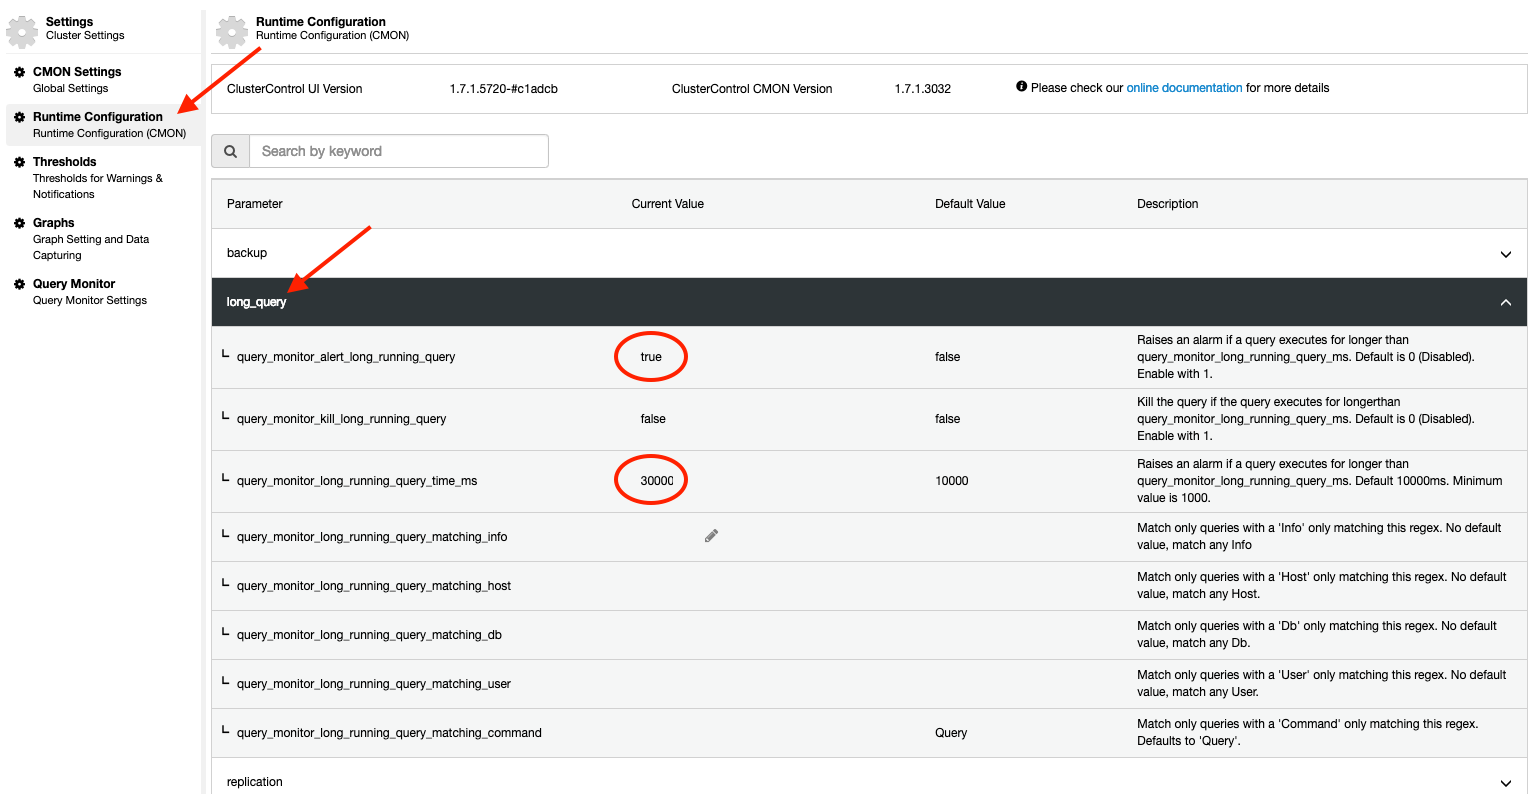
slow_query_log

Of course, this variable does not help boost your MySQL server. However, this variable can help you out analyze slow performing queries. Value can be set to 0 or OFF to disable logging. Setting it to 1 or ON to enable this. The default value depends on whether the --slow_query_log option is given. The destination for log output is controlled by the log_output system variable; if that value is NONE, no log entries are written even if the log is enabled. You might set the filename or destination of the query log file by setting the variable slow_query_log_file.

long_query_time

If a query takes longer than this many seconds, the server increments the Slow_queries status variable. If the slow query log is enabled, the query is logged to the slow query log file. This value is measured in real time, not CPU time, so a query that is under the threshold on a lightly loaded system might be above the threshold on a heavily loaded one. The minimum and default values of long_query_time are 0 and 10, respectively. Take note also that if variable min_examined_row_limit is set > 0, it won’t log queries even if it takes too long if the number of rows returned are less than the value set in min_examined_row_limit.

For more info on tuning your slow query logging, check the documentation here.

sync_binlog

This variable controls how often MySQL will sync binlogs to the disk. By default (>=5.7.7), this is set to 1 which means it will sync to disk before transactions are committed. However, this impose a negative impact on performance due to increased number of writes. But this is the safest setting if you want strictly ACID compliant along with your slaves. Alternatively, you can set this to 0 if you want to disable disk synchronization and just rely on the OS to flush the binary log to disk from time to time. Setting it higher than 1 means the binlog is sync to disk after N binary log commit groups have been collected, where N is > 1.

Dump/Restore Buffer Pool

It is pretty common thing that your production database needs to warm up from a cold start/restart. By dumping the current buffer pool before a restart, it would save the contents from the buffer pool and once it’s up, it’ll dump the contents back again from the buffer pool. Thus, this avoids the need to warm up your database back to the cache. Take note that, this version was since introduced in 5.6 but Percona Server 5.5 has it already available, just in case you wonder. To enable this feature, set both variables innodb_buffer_pool_dump_at_shutdown = ON and innodb_buffer_pool_load_at_startup = ON.

Hardware

We’re now in 2019, there has been a lot of new hardware improvements. Typically, there’s no hard requirement that MySQL would require a specific hardware, but this depends on what you need the database to do. I would expect that you are not reading this blog because you are doing a test if it runs on an Intel Pentium 200 MHz.

For CPU, faster processors with multiple cores will be optimal for MySQL in most recent versions at least since 5.6. Intel’s Xeon/Itanium processors can be expensive but tested for scalable and reliable computing platforms. Amazon has been shipping their EC2 instances running on ARM architecture. Though I personally haven’t tried running or recall running MySQL on ARM architecture, there are benchmarks that had been made years ago. Modern CPU’s can scale their frequencies up and down based on temperature, load, and OS power saving policies. However, there’s a chance that your CPU settings in your Linux OS set to a different governor. You can check that out or set with “performance” governor by doing the following:

echo performance | sudo tee /sys/devices/system/cpu/cpu[0-9]*/cpufreq/scaling_governor

For Memory, it is very important that your memory is large and can equate the size of your dataset. Ensure that you have swappiness = 1. You can check it out by checking sysctl or checking the file in procfs. This is achieved by doing the following:

$ sysctl -e vm.swappiness
vm.swappiness = 1

Or setting it to a value of 1 as follows

$ sudo sysctl vm.swappiness=1
vm.swappiness = 1

Another great thing to consider for your Memory management is considering turning off THP (Transparrent Huge Pages). In the past, I do recall we have some weird issues encountered with CPU utilization and thought it was due to disk I/O. It turned out, the problem was with kernel khugepaged thread which allocates memory dynamically during runtime. Not only this, during kernel goes for defragmentation, your memory will be quickly allocated as it passes it to THP. Standard HugePages memory is pre-allocated at startup, and does not change during runtime. You can verify and disable this by doing the following:

$ cat /sys/kernel/mm/transparent_hugepage/enabled
$ echo "never"> /sys/kernel/mm/transparent_hugepage/enabled

For Disk, it is important that you have a good throughput. Using RAID10 is the best setup for a database with a battery backup unit. With the advent of flash drives that offers high disk throughput and high disk I/O for read/writes, it is important that it can manage the high disk utilization and disk I/O.

Operating System

Most production systems running on MySQL runs on Linux. It is because MySQL had been tested and benchmarked on Linux, and sounds that it’s the de facto standard for a MySQL installation. However, of course, there’s nothing stopping you from using it on Unix or Windows platform. It would be easier if your platform has been tested and there is a wide community to help, in case you experience some trouble. Most setups runs on RHEL/Centos/Fedora and Debian/Ubuntu systems. In AWS, Amazon has their Amazon Linux which I see as well being used in production by some.

Most important to consider with your setup is that your file system is using either XFS or Ext4. For sure, there are pros and cons between these two file systems but I won’t go to the details here. Some say XFS outperform Ext4 but there are reports as well that Ext4 outperforms XFS. ZFS is also coming out of the picture as a good candidate for an alternative file system. Jervin Real (from Percona) has a great resource on this one, you can check this presentation during the ZFS conference.

External Links

https://developer.okta.com/blog/2015/05/22/tcmalloc

https://www.percona.com/blog/2012/07/05/impact-of-memory-allocators-on-mysql-performance/

https://www.percona.com/live/18/sessions/benchmark-noise-reduction-how-to-configure-your-machines-for-stable-results

https://zfs.datto.com/2018_slides/real.pdf

https://docs.oracle.com/en/database/oracle/oracle-database/12.2/ladbi/disabling-transparent-hugepages.html#GUID-02E9147D-D565-4AF8-B12A-8E6E9F74BEEA


Announcing ClusterControl 1.7.1: Support for PostgreSQL 11 and MongoDB 4.0, Enhanced Monitoring

$
0
0

We are excited to announce the 1.7.1 release of ClusterControl - the only management system you’ll ever need to take control of your open source database infrastructure!

ClusterControl 1.7.1 introduces the next phase of our exciting agent-based monitoring features for MySQL, Galera Cluster, PostgreSQL & ProxySQL, a suite of new features to help users fully automate and manage PostgreSQL (including support for PostgreSQL 11), support for MongoDB 4.0 ... and more!

Release Highlights

Performance Management

  • Enhanced performance dashboards for MySQL, Galera Cluster, PostgreSQL & ProxySQL
  • Enhanced query monitoring for PostgreSQL: view query statistics

Deployment & Backup Management

  • Create a cluster from backup for MySQL & PostgreSQL
  • Verify/restore backup on a standalone PostgreSQL host
  • ClusterControl Backup & Restore

Additional Highlights

  • Support for PostgreSQL 11 and MongoDB 4.0

View the ClusterControl ChangeLog for all the details!

ClusterControl
Single Console for Your Entire Database Infrastructure
Find out what else is new in ClusterControl

View Release Details and Resources

Release Details

Performance Management

Enhanced performance dashboards for MySQL, Galera Cluster, PostgreSQL & ProxySQL

Since October 2018, ClusterControl users have access to a set of monitoring dashboards that have Prometheus as the data source with its flexible query language and multi-dimensional data model, where time series data is identified by metric name and key/value pairs.

The advantage of this new agent-based monitoring infrastructure is that users can enable their database clusters to use Prometheus exporters to collect metrics on their nodes and hosts, thus avoiding excessive SSH activity for monitoring and metrics collections and use SSH connectivity only for management operations.

These Prometheus exporters can now be installed or enabled Prometheus on your nodes and hosts with MySQL, PostgreSQL and MongoDB based clusters. And you have the possibility to customize collector flags for the exporters (Prometheus), which allows you to disable collecting from MySQL's performance schema for example, if you experience load issues on your server.

This allows for greater accuracy and customization options while monitoring your database clusters. ClusterControl takes care of installing and maintaining Prometheus as well as exporters on the monitored hosts.

With this 1.7.1 release, ClusterControl now also comes with the next iteration of the following (new) dashboards:

  • System Overview
  • Cluster Overview
  • MySQL Server - General
  • MySQL Server - Caches
  • MySQL InnoDB Metrics
  • Galera Cluster Overview
  • Galera Server Overview
  • PostgreSQL Overview
  • ProxySQL Overview
  • HAProxy Overview
  • MongoDB Cluster Overview
  • MongoDB ReplicaSet
  • MongoDB Server

Do check them out and let us know what you think!

MongoDB Cluster Overview
HAProxy Overview
HAProxy Overview

Performance Management

Advanced query monitoring for PostgreSQL: view query statistics

ClusterControl 1.7.1 now comes with a whole range of new query statistics that can easily be viewed and monitored via the ClusterControl GUI. The following statistics are included in this new release:

  • Access by sequential or index scans
  • Table I/O statistics
  • Index I/O statistics
  • Database Wide Statistics
  • Table Bloat And Index Bloat
  • Top 10 largest tables
  • Database Sizes
  • Last analyzed or vacuumed
  • Unused indexes
  • Duplicate indexes
  • Exclusive lock waits
Table Bloat & Index Bloat

Deployment

Create a cluster from backup for MySQL & PostgreSQL

To be able to deliver database and application changes more quickly, several tasks must be automated. It can be a daunting job to ensure that a development team has the latest database build for the test when there is a proliferation of copies, and the production database is in use.

ClusterControl provides a single process to create a new cluster from backup with no impact on the source database system.

With this new release, you can easily create MySQL Galera or PostgreSQL including the data from backup you need.

Backup Management

ClusterControl Backup/Restore

ClusterControl users can use this new feature to migrate a setup from one controller to another controller; and backup the meta-data of an entire controller or individual clusters from the s9s CLI. The backup can then be restored on a new controller with a new hostname/IP and the restore process will automatically recreate database access privileges. Check it out!

Additional New Functionalities

View the ClusterControl ChangeLog for all the details!

Download ClusterControl today!

Happy Clustering!

MySQL Performance Benchmarking: MySQL 5.7 vs MySQL 8.0

$
0
0

MySQL 8.0 brought enormous changes and modifications that were pushed by the Oracle MySQL Team. Physical files have been changed. For instance, *.frm, *.TRG, *.TRN, and *.par no longer exist. Tons of new features have been added such as CTE (Common Table Expressions), Window Functions, Invisible Indexes, regexp (or Regular Expression)--the latter has been changed and now provides full Unicode support and is multibyte safe. Data dictionary has also changed. It’s now incorporated with a transactional data dictionary that stores information about database objects. Unlike previous versions, dictionary data was stored in metadata files and non-transactional tables. Security has been improved with the new addition of caching_sha2_password which is now the default authentication replacing mysql_native_password and offers more flexibility but tightened security which must use either a secure connection or an unencrypted connection that supports password exchange using an RSA key pair.

With all of these cool features, enhancements, improvements that MySQL 8.0 offers, our team was interested to determine how well the current version MySQL 8.0 performs especially given that our support for MySQL 8.0.x versions in ClusterControl is on its way (so stay tuned on this). This blog post won’t be discussing the features of MySQL 8.0, but intends to benchmark its performance against MySQL 5.7 and see how it has improved then.

Server Setup and Environment

For this benchmark, I intend to use a minimal setup for production using the following AWS EC2 environment:

Instance-type: t2.xlarge instance
Storage: gp2 (SSD storage with minimum of 100 and maximum of 16000 IOPS)
vCPUS: 4
Memory: 16GiB
MySQL 5.7 version: MySQL Community Server (GPL) 5.7.24
MySQL 8.0 version: MySQL Community Server - GPL 8.0.14

There are few notable variables that I have set for this benchmark as well, which are:

  • innodb_max_dirty_pages_pct = 90 ## This is the default value in MySQL 8.0. See here for details.
  • innodb_max_dirty_pages_pct_lwm=10 ## This is the default value in MySQL 8.0
  • innodb_flush_neighbors=0
  • innodb_buffer_pool_instances=8
  • innodb_buffer_pool_size=8GiB

The rest of the variables being set here for both versions (MySQL 5.7 and MySQL 8.0) are tuned up already by ClusterControl for its my.cnf template.

Also, the user I used here does not conform to the new authentication of MySQL 8.0 which uses caching_sha2_password. Instead, both server versions uses mysql_native_password plus innodb_dedicated_server variable is OFF (default), which is a new feature of MySQL 8.0.

To make life easier, I setup MySQL 5.7 Community version node with ClusterControl from a separate host then removed the node in a cluster and shutdown the ClusterControl host to make MySQL 5.7 node dormant (no monitoring traffic). Technically, both nodes MySQL 5.7 and MySQL 8.0 are dormant and no active connections are going through the nodes, so it’s essentially a pure benchmarking test.

Commands and Scripts Used

For this task, sysbench is used for testing and load simulation for the two environments. Here are the following commands or script being used on this test:

sb-prepare.sh

#!/bin/bash

host=$1
#host192.168.10.110
port=3306
user='sysbench'
password='MysqP@55w0rd'
table_size=500000
rate=20
ps_mode='disable'
sysbench /usr/share/sysbench/oltp_read_write.lua --db-driver=mysql --threads=1 --max-requests=0 --time=3600 --mysql-host=$host --mysql-user=$user --mysql-password=$password --mysql-port=$port --tables=10 --report-interval=1 --skip-trx=on --table-size=$table_size --rate=$rate --db-ps-mode=$ps_mode prepare

sb-run.sh

#!/usr/bin/env bash

host=$1
port=3306
user="sysbench"
password="MysqP@55w0rd"
table_size=100000
tables=10
rate=20
ps_mode='disable'
threads=1
events=0
time=5
trx=100
path=$PWD

counter=1

echo "thread,cpu"> ${host}-cpu.csv

for i in 16 32 64 128 256 512 1024 2048; 
do 

    threads=$i

    mysql -h $host -e "SHOW GLOBAL STATUS">> $host-global-status.log
    tmpfile=$path/${host}-tmp${threads}
    touch $tmpfile
    /bin/bash cpu-checker.sh $tmpfile $host $threads &

    /usr/share/sysbench/oltp_read_write.lua --db-driver=mysql --events=$events --threads=$threads --time=$time --mysql-host=$host --mysql-user=$user --mysql-password=$password --mysql-port=$port --report-interval=1 --skip-trx=on --tables=$tables --table-size=$table_size --rate=$rate --delete_inserts=$trx --order_ranges=$trx --range_selects=on --range-size=$trx --simple_ranges=$trx --db-ps-mode=$ps_mode --mysql-ignore-errors=all run | tee -a $host-sysbench.log

    echo "${i},"`cat ${tmpfile} | sort -nr | head -1` >> ${host}-cpu.csv
    unlink ${tmpfile}

    mysql -h $host -e "SHOW GLOBAL STATUS">> $host-global-status.log
done

python $path/innodb-ops-parser.py $host

mysql -h $host -e "SHOW GLOBAL VARIABLES">> $host-global-vars.log

So the script simply prepares the sbtest schema and populates tables and records. Then it performs read/write load tests using /usr/share/sysbench/oltp_read_write.lua script. The script dumps global status and MySQL variables, collects CPU utilization, and parses InnoDB row operations handled by script innodb-ops-parser.py. The scripts then generates *.csv files based on the dumped logs that were collected during the benchmark, then I used an Excel spreadsheet here to generate the graph from *.csv files. Please check the code here in this github repository.

Now, let’s proceed with the graph results!

InnoDB Row Operations

Basically here, I only extracted the InnoDB row operations which does the selects (reads), deletes, inserts, and updates. When number of threads goes up, MySQL 8.0 significantly outperforms MySQL 5.7! Both versions do not have any specific config changes, but only the notable variables I have set. So both versions are pretty much using default values.

Interestingly, with regards to the claims of the MySQL Server Team about the performance of reads and writes in the new version, the graphs point to a significant performance improvement, especially in a high-load server. Imagine the difference between MySQL 5.7 versus MySQL 8.0 for all its InnoDB row operations, there’s a high difference especially when number of threads goes up. MySQL 8.0 reveals that it can perform efficiently regardless of its workload.

Transactions Processed

As shown in the graph above, MySQL 8.0 performance shows again a huge difference in the time it takes to process transactions. The lower, the better it performs which means it’s faster to process transactions. The transactions processed (the second graph) also reveals that both numbers of transactions do not differ from each other. Meaning, both versions executes almost the same number of transactions but differ in how fast it can finish. Although I could say, MySQL 5.7 still can handle a lot at lower load, but the realistic load especially in production could be expected to be higher - especially the busiest period.

The graph above still shows the transactions it was able to process but separates the read from writes. However, there’s actually outliers in the graphs which I didn’t include as they’re tiny tidbits of the result which would skew the graph.

MySQL 8.0 reveals a great improvements especially for doing reads. It displays its efficiency in writes especially for servers with a high workload. Some great added support that impacts MySQL performance for reads in version 8.0 is the ability to create an index in descending order (or forward index scans). Previous versions had only ascending or backward index scan, and MySQL had to do filesort if it needed a descending order (if filesort is needed, you might consider checking the value of max_length_for_sort_data). Descending indexes also make it possible for the optimizer to use multiple-column indexes when the most efficient scan order mixes ascending order for some columns and descending order for others. See here for more details.

ClusterControl
Single Console for Your Entire Database Infrastructure
Find out what else is new in ClusterControl

CPU Resources

During this benchmarking, I decided to take some hardware resources, most notably, the CPU utilization.

Let me explain first how I take the CPU resource here during benchmarking. sysbench does not include collective statistics for hardware resources utilized or used during the process when you are benchmarking a database. Because of that, what I did is to create a flag by creating a file, connect to the target host through SSH, and then harvest data from Linux command “top” and parse it while sleeping for a second before collecting again. After that, take the most outstanding increase of CPU usage for the mysqld process and then remove the flag file. You can review the code there I have in github.

So let’s discuss again about the graph result, it seems to reveal that MySQL 8.0 consumes a lot of CPU. More than MySQL 5.7. However, it might have to deal with new variables added in MySQL 8.0. For example, these variables might impact your MySQL 8.0 server:

The variables with its values are left by its default values for this benchmark. The first three variables handles CPU for redo logging, which in MySQL 8.0 has been an improvement due to re-designing how InnoDB writes to the REDO log. The variable innodb_log_spin_cpu_pct_hwm has CPU affinity, which means it would ignore other CPU cores if mysqld is pinned only to 4 cores, for instance. For parallel read threads, in MySQL 8.0, it adds a new variable for which you can tune how many threads to used.

However, I did not dig further into the subject. There can be ways that performance can be improved by taking advantage of the features that MySQL 8.0 has to offer.

Conclusion

There are tons of improvements that are present in MySQL 8.0. The benchmark results reveals that there has been an impressive improvement, not only on managing read workloads, but also on a high read/write workload comparing to MySQL 5.7.

Going over to the new features that MySQL 8.0, it looks to be that it has taken advantage of the most up-to-date technologies not only on software (like great improvement for Memcached, Remote Management for better DevOps work, etc.) but also in hardware. Taken for example, the replacement of latin1 with UTF8MB4 as the default character encoding. This would mean that it would require more disk space since UTF8 needs 2-bytes on the non-US-ASCII characters. Although this benchmark did not take advantage of using the new authentication method with caching_sha2_password, it won’t affect performance whether it uses encryption. Once it’s authenticated, it is stored in cache which means authentication is only done once. So if you are using one user for your client, it won’t be a problem and is more secure than the previous versions.

Since MySQL leverages the most up-to-date hardware and software, it changes its default variables. You can read here for more details.

Overall, MySQL 8.0 has dominated MySQL 5.7 efficiently.

How Roles Have Changed in MySQL 8.0 and How to Use Them

$
0
0

Database Security is important to any MySQL setup. Users are the foundation of any system. In terms of database systems, I generally think of them in two distinct groups:

  1. Application, service, or program users - basically customers or clients using a service.
  2. Database developers, administrators, analyst, etc… - Those maintaining, working with or monitoring the database infrastructure.

While each user does need to access the database at some level, those permissions are not all created equal.

For instance, clients and customers need access to their 'related user account' data, but even that should be monitored with some level of control. However, some tables and data should be strictly off-limits (E.g., system tables).

Nevertheless:

  • Analyst need 'read access', to garner information and insight via querying tables…
  • Developers require a slew of permissions and privileges to carry out their work…
  • DBA's need 'root' or similar type privileges to run the show…
  • Buyers of a service need to see their order and payment history…

You can imagine (I know I do) just how difficult a task managing multiple users or groups of users within a database ecosystem is.

In older versions of MySQL, a multiple-user environment is established in a somewhat monotonous and repetitive manner.

Yet, version 8 implements an exceptional, and powerful, SQL standard feature - Roles - which alleviates one of the more redundant areas of the entire process: assigning privileges to a user.

So, what is a role in MySQL?

You can surely visit, MySQL in 2018: What’s in 8.0 and Other Observations, I wrote for the Severalnines blog here where I mention roles for a high-level overview. However, where I only summarized them there, this current post looks to go deeper and focus solely on roles.

Here is how the online MySQL documentation defines a role: "A MySQL role is a named collection of privileges".

Doesn't that definition alone seem helpful?

But how?

We will see in the examples that follow.

To Make Note of the Examples Provided

The examples included in this post are in a personal 'single-user' development and learning workstation/environment so be sure and implement those best practices that benefit you for your particular needs or requirements. The user names and passwords demonstrated are purely arbitrary and weak.

Users and Privileges in Previous Versions

In MySQL 5.7, roles do not exist. Assigning privileges to users is done individually. To better understand what roles do provide, let's not use them. That doesn't make any sense at all, I know. But, as we progress through the post, it will.

Below we create some users:

CREATE USER 'reader_1'@'localhost' IDENTIFIED BY 'some_password'; 
CREATE USER 'reader_writer'@'localhost' IDENTIFIED BY 'another_password'; 
CREATE USER 'changer_1'@'localhost' IDENTIFIED BY 'a_password';

Then those users are granted some privileges:

GRANT SELECT ON some_db.specific_table TO 'reader_1'@'localhost';
GRANT SELECT, INSERT ON some_db.specific_table TO 'reader_writer'@'localhost';
GRANT UPDATE, DELETE ON some_db.specific_table TO 'changer_1'@'localhost';

Whew, glad that is over. Now back to…

And just like that, you have a request to implement two more 'read-only' users…

Back to the drawing board:

CREATE USER 'reader_2'@'localhost' IDENTIFIED BY 'password_2'; 
CREATE USER 'reader_3'@'localhost' IDENTIFIED BY 'password_3';

Assigning them privileges as well:

GRANT SELECT ON some_db.specific_table TO 'reader_2'@'localhost';
GRANT ALL ON some_db.specific_table TO 'reader_3'@'localhost';

Can you see how this is less-than-productive, full of repetition, and error-prone? But, more importantly, did you catch the mistake?

Good for you!

While granting privileges for these two additional users, I accidentally granted ALL privileges to new user reader_3.

Oops.

A mistake that anyone could make.

Enter MySQL Roles

With roles, much of the above systematic privilege assignment and delegation can be somewhat streamlined.

User creation basically remains the same, but it's assigning privileges through roles that differs:

mysql> CREATE USER 'reader_1'@'localhost' IDENTIFIED BY 'some_password';
Query OK, 0 rows affected (0.19 sec)
mysql> CREATE USER 'reader_writer'@'localhost' IDENTIFIED BY 'another_password';
Query OK, 0 rows affected (0.22 sec)
mysql> CREATE USER 'changer_1'@'localhost' IDENTIFIED BY 'a_password';
Query OK, 0 rows affected (0.08 sec)
mysql> CREATE USER 'reader_2'@'localhost' IDENTIFIED BY 'password_2';
Query OK, 0 rows affected (0.28 sec)
mysql> CREATE USER 'reader_3'@'localhost' IDENTIFIED BY 'password_3';
Query OK, 0 rows affected (0.12 sec)

Querying the mysql.user system table, you can see those newly created users exist:

(Note: I have several user accounts in this learning/development environment and have suppressed much of the output for better on-screen clarity.)

mysql> SELECT User FROM mysql.user;
+------------------+
| User             |
+------------------+
| changer_1        |
| mysql.infoschema |
| mysql.session    |
| mysql.sys        |
| reader_1         |
| reader_2         |
| reader_3         |
| reader_writer    |
| root             |
|                  | --multiple rows remaining here...
+------------------+
23 rows in set (0.00 sec)

I have this arbitrary table and sample data:

mysql> SELECT * FROM name;
+--------+------------+
| f_name | l_name     |
+--------+------------+
| Jim    | Dandy      |
| Johhny | Applesauce |
| Ashley | Zerro      |
| Ashton | Zerra      |
| Ashmon | Zerro      |
+--------+------------+
5 rows in set (0.00 sec)

Let's now use roles to establish and assign, privileges for the new users to use the name table.

First, create the roles:

mysql> CREATE ROLE main_read_only;
Query OK, 0 rows affected (0.11 sec)
mysql> CREATE ROLE main_read_write;
Query OK, 0 rows affected (0.11 sec)
mysql> CREATE ROLE main_changer;
Query OK, 0 rows affected (0.14 sec)

Notice the mysql.user table again:

mysql> SELECT User FROM mysql.user;
+------------------+
| User             |
+------------------+
| main_changer     |
| main_read_only   |
| main_read_write  |
| changer_1        |
| mysql.infoschema |
| mysql.session    |
| mysql.sys        |
| reader_1         |
| reader_2         |
| reader_3         |
| reader_writer    |
| root             |
|                  |
+------------------+
26 rows in set (0.00 sec)

Based on this output, we can surmise; that in all essence, roles are in fact, users themselves.

Next, privilege assignment:

mysql> GRANT SELECT ON practice.name TO 'main_read_only';
Query OK, 0 rows affected (0.14 sec)
mysql> GRANT SELECT, INSERT ON practice.name TO 'main_read_write';
Query OK, 0 rows affected (0.07 sec)
mysql> GRANT UPDATE, DELETE ON practice.name TO 'main_changer';
Query OK, 0 rows affected (0.16 sec)

A Brief Interlude

Wait a minute. Can I just log in and carry out any tasks with the role accounts themselves? After all, they are users and they have the required privileges.

Let's attempt to log in to the practice database with role main_changer:

:~$ mysql -u main_changer -p practice
Enter password: 
ERROR 1045 (28000): Access denied for user 'main_changer'@'localhost' (using password: YES

The simple fact that we are presented with a password prompt is a good indication that we cannot (at this time at least). As you recall, I did not set a password for any of the roles during their creation.

What does the mysql.user system tables'authentication_string column have to say?

mysql> SELECT User, authentication_string, password_expired
    -> FROM mysql.user
    -> WHERE User IN ('main_read_only', 'root', 'main_read_write', 'main_changer')\G
*************************** 1. row ***************************
                 User: main_changer
authentication_string: 
     password_expired: Y
*************************** 2. row ***************************
                 User: main_read_only
authentication_string: 
     password_expired: Y
*************************** 3. row ***************************
                 User: main_read_write
authentication_string: 
     password_expired: Y
*************************** 4. row ***************************
                 User: root
authentication_string: ***various_jumbled_mess_here*&&*&*&*##
     password_expired: N
4 rows in set (0.00 sec)

I included the root user among the role names for the IN() predicate check to simply demonstrate it has an authentication_string, where the roles do not.

This passage in the CREATE ROLE documentation clarifies it nicely: "A role when created is locked, has no password, and is assigned the default authentication plugin. (These role attributes can be changed later with the ALTER USER statement, by users who have the global CREATE USER privilege.)"

Back to the task at hand, we can now assign the roles to users based on their needed level of privileges.

Notice no ON clause is present in the command:

mysql> GRANT 'main_read_only' TO 'reader_1'@'localhost', 'reader_2'@'localhost', 'reader_3'@'localhost';
Query OK, 0 rows affected (0.13 sec)
mysql> GRANT 'main_read_write' TO 'reader_writer'@'localhost';
Query OK, 0 rows affected (0.16 sec)
mysql> GRANT 'main_changer', 'main_read_only' TO 'changer_1'@'localhost';
Query OK, 0 rows affected (0.13 sec)

It may be less confusing if you use some sort of 'naming convention' when establishing role names, (I am unaware if MySQL provides one at this time… Community?) if for no other reason than to differentiate between them and regular 'non-role' users visually.

ClusterControl
Single Console for Your Entire Database Infrastructure
Find out what else is new in ClusterControl

There is Still Some Work Left To Do

That was super-easy wasn't it?

Less redundant than the old way of privilege assignment.

Let's put those users to work now.

We can see the granted privileges for a user with SHOW GRANTS syntax. Here is what is currently assigned to the reader_1 user account:

mysql> SHOW GRANTS FOR 'reader_1'@'localhost';
+------------------------------------------------------+
| Grants for reader_1@localhost                        |
+------------------------------------------------------+
| GRANT USAGE ON *.* TO `reader_1`@`localhost`         |
| GRANT `main_read_only`@`%` TO `reader_1`@`localhost` |
+------------------------------------------------------+
2 rows in set (0.02 sec)

Although that does provide an informative output, you can 'tune' the statement for even more granular information on any exact privileges an assigned role provides by including a USING clause in the SHOW GRANTS statement and naming the assigned roles name:

mysql> SHOW GRANTS FOR 'reader_1'@'localhost' USING 'main_read_only';
+-------------------------------------------------------------+
| Grants for reader_1@localhost                               |
+-------------------------------------------------------------+
| GRANT USAGE ON *.* TO `reader_1`@`localhost`                |
| GRANT SELECT ON `practice`.`name` TO `reader_1`@`localhost` |
| GRANT `main_read_only`@`%` TO `reader_1`@`localhost`        |
+-------------------------------------------------------------+
3 rows in set (0.00 sec)

After logging in with reader_1:

mysql> SELECT * FROM practice.name;
ERROR 1142 (42000): SELECT command denied to user 'reader_1'@'localhost' for table 'name'

What on earth? That user was granted SELECT privileges through role main_read_only.

To investigate, let's visit 2 new tables in version 8, specifically for roles.

The mysql.role_edges table shows what roles have been granted to any users:

mysql> SELECT * FROM mysql.role_edges;
+-----------+-----------------+-----------+---------------+-------------------+
| FROM_HOST | FROM_USER       | TO_HOST   | TO_USER       | WITH_ADMIN_OPTION |
+-----------+-----------------+-----------+---------------+-------------------+
| %         | main_changer    | localhost | changer_1     | N                 |
| %         | main_read_only  | localhost | changer_1     | N                 |
| %         | main_read_only  | localhost | reader_1      | N                 |
| %         | main_read_only  | localhost | reader_2      | N                 |
| %         | main_read_only  | localhost | reader_3      | N                 |
| %         | main_read_write | localhost | reader_writer | N                 |
+-----------+-----------------+-----------+---------------+-------------------+
6 rows in set (0.00 sec)

But, I feel the other additional table, mysql.default_roles, will better help us solve the SELECT problems for user reader_1:

mysql> DESC mysql.default_roles;
+-------------------+----------+------+-----+---------+-------+
| Field             | Type     | Null | Key | Default | Extra |
+-------------------+----------+------+-----+---------+-------+
| HOST              | char(60) | NO   | PRI |         |       |
| USER              | char(32) | NO   | PRI |         |       |
| DEFAULT_ROLE_HOST | char(60) | NO   | PRI | %       |       |
| DEFAULT_ROLE_USER | char(32) | NO   | PRI |         |       |
+-------------------+----------+------+-----+---------+-------+
4 rows in set (0.00 sec)
mysql> SELECT * FROM mysql.default_roles;
Empty set (0.00 sec)

Empty results set.

Turns out, in order for a user to be able to use a role - and ultimately the privileges - the user must be assigned a default role.

mysql> SET DEFAULT ROLE main_read_only TO 'reader_1'@'localhost', 'reader_2'@'localhost', 'reader_3'@'localhost';
Query OK, 0 rows affected (0.11 sec)

(A default role can be assigned to multiple users in one command as above…)

mysql> SET DEFAULT ROLE main_read_only, main_changer TO 'changer_1'@'localhost';
Query OK, 0 rows affected (0.10 sec)

(A user can have multiple default roles specified as in the case for user changer_1…)

User reader_1 is now logged in...

mysql> SELECT CURRENT_USER();
+--------------------+
| CURRENT_USER()     |
+--------------------+
| reader_1@localhost |
+--------------------+
1 row in set (0.00 sec)
mysql> SELECT CURRENT_ROLE();
+----------------------+
| CURRENT_ROLE()       |
+----------------------+
| `main_read_only`@`%` |
+----------------------+
1 row in set (0.03 sec)

We can see the currently active role and also, that reader_1 can issue SELECT commands now:

mysql> SELECT * FROM practice.name;
+--------+------------+
| f_name | l_name     |
+--------+------------+
| Jim    | Dandy      |
| Johhny | Applesauce |
| Ashley | Zerro      |
| Ashton | Zerra      |
| Ashmon | Zerro      |
+--------+------------+
5 rows in set (0.00 sec)

Other Hidden Nuances

There is another important part of the puzzle we need to understand.

There are potentially 3 different 'levels' or 'variants' of role assignment:

SET ROLE …;
SET DEFAULT ROLE …;
SET ROLE DEFAULT …;

I'll GRANT an additional role to user reader_1 and then login with that user (not shown):

mysql> GRANT 'main_read_write' TO 'reader_1'@'localhost';
Query OK, 0 rows affected (0.17 sec)

Since role main_read_write does have the INSERT privilege, user reader_1 can now run that command right?

mysql> INSERT INTO name(f_name, l_name)
    -> VALUES('Josh', 'Otwell');
ERROR 1142 (42000): INSERT command denied to user 'reader_1'@'localhost' for table 'name'

What is going on here?

This may help...

mysql> SELECT CURRENT_ROLE();
+----------------------+
| CURRENT_ROLE()       |
+----------------------+
| `main_read_only`@`%` |
+----------------------+
1 row in set (0.00 sec)

Recall, we initially set user reader_1 a default role of main_read_only. This is where we need to use one of those distinct 'levels' of what I loosely term'role setting':

mysql> SET ROLE main_read_write;
Query OK, 0 rows affected (0.00 sec)
mysql> SELECT CURRENT_ROLE();
+-----------------------+
| CURRENT_ROLE()        |
+-----------------------+
| `main_read_write`@`%` |
+-----------------------+
1 row in set (0.00 sec)

Now attempt that INSERT again:

mysql> INSERT INTO name(f_name, l_name)
    -> VALUES('Josh', 'Otwell');
Query OK, 1 row affected (0.12 sec)

However, once user reader_1 logs back out, role main_read_write will no longer be active when reader_1 logs back in. Although user reader_1 does have the main_read_write role granted to it, it is not the default.

Let’s now come to know the 3rd 'level' of 'role setting', SET ROLE DEFAULT.

Suppose user reader_1 has no roles assigned yet:

mysql> SHOW GRANTS FOR 'reader_1'@'localhost';
+----------------------------------------------+
| Grants for reader_1@localhost                |
+----------------------------------------------+
| GRANT USAGE ON *.* TO `reader_1`@`localhost` |
+----------------------------------------------+
1 row in set (0.00 sec)

Let’s GRANT this user 2 roles:

mysql> GRANT 'main_changer', 'main_read_write' TO 'reader_1'@'localhost';
Query OK, 0 rows affected (0.07 sec)

Assign a default role:

mysql> SET DEFAULT ROLE ‘main_changer’ TO 'reader_1'@'localhost';
Query OK, 0 rows affected (0.17 sec)

Then with user reader_1 logged in, that default role is active:

mysql> SELECT CURRENT_ROLE();
+--------------------+
| CURRENT_ROLE()     |
+--------------------+
| `main_changer`@`%` |
+--------------------+
1 row in set (0.00 sec)

Now switch to role main_read_write:

mysql> SET ROLE 'main_read_write';
Query OK, 0 rows affected (0.01 sec)
mysql> SELECT CURRENT_ROLE();
+-----------------------+
| CURRENT_ROLE()        |
+-----------------------+
| `main_read_write`@`%` |
+-----------------------+
1 row in set (0.00 sec)

But, to return back to the assigned default role, use SET ROLE DEFAULT as shown below:

mysql> SET ROLE DEFAULT;
Query OK, 0 rows affected (0.00 sec)
mysql> SELECT CURRENT_ROLE();
+--------------------+
| CURRENT_ROLE()     |
+--------------------+
| `main_changer`@`%` |
+--------------------+
1 row in set (0.00 sec)

Roles Not Granted

Even though user changer_1 has 2 roles available during a session:

mysql> SELECT CURRENT_ROLE();
+-----------------------------------------+
| CURRENT_ROLE()                          |
+-----------------------------------------+
| `main_changer`@`%`,`main_read_only`@`%` |
+-----------------------------------------+
1 row in set (0.00 sec)

What happens if you attempt and set a user to a role they have not been granted?

mysql> SET ROLE main_read_write;
ERROR 3530 (HY000): `main_read_write`@`%` is not granted to `changer_1`@`localhost`

Denied.

Taketh Away

No user management system would be complete without the ability to constrain or even remove access to certain operations should the need arise.

We have the SQL REVOKE command at our disposal to remove privileges from users and roles.

Recall that role main_changer has this set of privileges, essentially, all of those users granted this role do as well:

mysql> SHOW GRANTS FOR main_changer;
+-----------------------------------------------------------------+
| Grants for main_changer@%                                       |
+-----------------------------------------------------------------+
| GRANT USAGE ON *.* TO `main_changer`@`%`                        |
| GRANT UPDATE, DELETE ON `practice`.`name` TO `main_changer`@`%` |
+-----------------------------------------------------------------+
2 rows in set (0.00 sec)
mysql> REVOKE DELETE ON practice.name FROM 'main_changer';
Query OK, 0 rows affected (0.11 sec)
mysql> SHOW GRANTS FOR main_changer;
+---------------------------------------------------------+
| Grants for main_changer@%                               |
+---------------------------------------------------------+
| GRANT USAGE ON *.* TO `main_changer`@`%`                |
| GRANT UPDATE ON `practice`.`name` TO `main_changer`@`%` |
+---------------------------------------------------------+
2 rows in set (0.00 sec)

To know what users this change affected, we can visit the mysql.role_edges table again:

mysql> SELECT * FROM mysql.role_edges WHERE FROM_USER = 'main_changer';
+-----------+--------------+-----------+-----------+-------------------+
| FROM_HOST | FROM_USER    | TO_HOST   | TO_USER   | WITH_ADMIN_OPTION |
+-----------+--------------+-----------+-----------+-------------------+
| %         | main_changer | localhost | changer_1 | N                 |
+-----------+--------------+-----------+-----------+-------------------+
1 row in set (0.00 sec)

And we can see that user changer_1 no longer has the DELETE privilege:

mysql> SHOW GRANTS FOR 'changer_1'@'localhost' USING 'main_changer';
+--------------------------------------------------------------------------+
| Grants for changer_1@localhost                                           |
+--------------------------------------------------------------------------+
| GRANT USAGE ON *.* TO `changer_1`@`localhost`                            |
| GRANT UPDATE ON `practice`.`name` TO `changer_1`@`localhost`             |
| GRANT `main_changer`@`%`,`main_read_only`@`%` TO `changer_1`@`localhost` |
+--------------------------------------------------------------------------+
3 rows in set (0.00 sec)

Finally, if we need to get rid of a role completely, we have the DROP ROLE command for that:

mysql> DROP ROLE main_read_only;
Query OK, 0 rows affected (0.17 sec)

And querying the mysql.role_edges table, role main_read_only has been removed:

mysql> SELECT * FROM mysql.role_edges;
+-----------+-----------------+-----------+---------------+-------------------+
| FROM_HOST | FROM_USER       | TO_HOST   | TO_USER       | WITH_ADMIN_OPTION |
+-----------+-----------------+-----------+---------------+-------------------+
| %         | main_changer    | localhost | changer_1     | N                 |
| %         | main_read_write | localhost | reader_1      | N                 |
| %         | main_read_write | localhost | reader_writer | N                 |
+-----------+-----------------+-----------+---------------+-------------------+
3 rows in set (0.00 sec)

(Bonus: This fantastic YouTube video was a great learning resource for me on Roles.)

This example of user creation, role assignment, and setup is rudimentary at best. Yet, roles have their own set of rules that make them far from trivial. My hope is that through this blog post, I have shed light on those areas that are less intuitive than others, enabling readers to better understand potential role uses within their systems.

Thank you for reading.

MySQL to MongoDB - An Admin Cheat Sheet

$
0
0

Most software applications nowadays involve some dynamic data storage for extensive future reference in the application itself. We all know data is stored in a database which falls into two categories that are: Relational and Non-relational DBMS.

Your choice of selection from these two will fully depend on your data structure, amount of data involved, database performance and scalability.

Relational DBMS store data in tables in terms of rows such that they use Structured Querying Language (SQL) making them a good choice for applications involving several transactions. They include MySQL, SQLite, and PostgreSQL.

On the other hand, NoSQL DBMS such as MongoDB are document-oriented such that data is stored in collections in terms of documents. This gives a greater storage capacity for a large set of data hence a further advantage in scalability.

In this blog we are assuming you have a better knowledge for either MongoDB or MySQL and hence would like to know the correlation between the two in terms of querying and database structure.

Below is a cheat sheet to further familiarize yourself with the querying of MySQL to MongoDB.

MySQL to MongoDB Cheat Sheet - Terms

MySQL TermsMongoDB TermsExplanation
TableCollectionThis is the storage container for data that tends to be similar in the contained objects.
RowDocumentDefines the single object entity in the table for MySQL and collection in the case of MongoDB.
ColumnFieldFor every stored item, it has properties which are defined by different values and data types. In MongoDB, documents in the same collection, may have different fields from each other. In MySQL, every row must be defined with the same columns from the existing ones.
Primary keyPrimary keyEvery stored object is identified with a unique field value in the case of MongoDB we have _id field set automatically whereas in MySQL you can define your own primary key which is incremental as you create new rows.
Table JoinsEmbedding and linking documentsConnection associated with an object in a different collection/table to data in another collection/table.
where$matchSelecting data that matches criteria.
group$groupGrouping data according to some criteria.
drop$unsetRemoving a column/field from a row/document/
set$setSetting the value of an existing column/field to a new value.
Severalnines
 
Become a MongoDB DBA - Bringing MongoDB to Production
Learn about what you need to know to deploy, monitor, manage and scale MongoDB

Schema Statements

MySQL Table StatementsMongoDB Collection StatementsExplanation

The database and tables are created explicitly through the PHP admin panel or defined within a script i.e

Creating a Database

CREATE DATABASE database_name

Creating a table

CREATE TABLE users (
    id MEDIUMINT NOT NULL
        AUTO_INCREMENT,
    UserId Varchar(30),
    Age Number,
    Gender char(1),
    Name VarChar(222),
    PRIMARY KEY (id)
)

The database can be created implicitly or explicitly. Implicitly during the first document insert the database and collection are created as well as an automatic _id field being added to this document.

db.users.insert( {
    UserId: "user1",
    Age: 55,
    Name: "Berry Hellington",
    Gender: "F",
 } )

You can also create the database explicitly by running this comment in the Mongo Shell

db.createCollection("users")

In MySQL, you have to specify the columns in the table you are creating as well as setting some validation rules like in this example the type of data and length that goes to a specific column. In the case of MongoDB, it is not a must to define neither the fields each document should hold nor the validation rules the specified fields should hold.

However, in MongoDB for data integrity and consistency you can set the validation rules using the JSON SCHEMA VALIDATOR

Dropping a table

DROP TABLE users
db.users.drop()

This are statements for deleting a table for MySQL and collection in the case of MongoDB.

Adding a new column called join_date

ALTER TABLE users ADD join_date DATETIME

Removing the join_date column if already defined

ALTER TABLE users DROP COLUMN join_date DATETIME

Adding a new field called join_date

db.users.updateMany({},{$set:{‘join_date’: new Date()})

This will update all documents in the collection to have the join date as the current date.

Removing the join_date field if already defined

db.users.updateMany({},{$unset:{‘join_date’: “”})

This will remove the join_date field from all the collection documents.

Altering the structure of the schema by either adding or dropping a column/field.

Since the MongoDB architecture does not strictly enforce on the document structure, documents may have fields different from each other.

Creating an index with the UserId column ascending and Age descending

CREATE INDEX idx_UserId_asc_Age_desc
ON users(UserId)

Creating an index involving the UserId and Age fields.

db.users.ensureIndex( { UserId: 1, Age: -1 } )

Indices are generally created to facilitate the querying process.

INSERT INTO users(UserId,
                  Age,
                  Gender)
VALUES ("user1",
        25,
        "M")
db.users.insert( {
       UserId: "bcd001",
       Age: 25,
       Gender: "M",
     Name: "Berry Hellington",
} )

Inserting new records.

DELETE FROM users
WHERE Age = 25
db.users.deleteMany( { Age = 25 } )

Deleting records from the table/collection whose age is equal to 25.

DELETE FROM users
db.users.deleteMany({})

Deleting all records from the table/collection.

SELECT * FROM users
db.users.find()

Returns all records from the users table/collection with all columns/fields.

SELECT id, Age, Gender FROM users
db.users.find(
   { },
   { Age: 1, Gender: 1 }
)

Returns all records from the users table/collection with Age, Gender and primary key columns/fields.

SELECT  Age, Gender FROM users
db.users.find(
   { },
 { Age: 1, Gender: 1,_id: 0}
)

Returns all records from the users table/collection with Age and Gender columns/fields. The primary key is omitted.

SELECT * FROM users WHERE Gender = “M”
db.users.find({ Gender: "M"})

Returns all records from the users table/collection whose Gender value is set to M.

SELECT Gender FROM users WHERE Age = 25
db.users.find({ Age: 25}, { _id: 0, Gender: 1})

Returns all records from the users table/collection with only the Gender value but whose Age value is equal to 25.

SELECT * FROM users WHERE Age = 25 AND Gender = ‘F’
db.users.find({ Age: 25, Gender: "F"})

Returns all records from the users table/collection whose Gender value is set to F and Age is 25.

SELECT * FROM users WHERE  Age != 25
db.users.find({ Age:{$ne: 25}})

Returns all records from the users table/collection whose Age value is not equal to 25.

SELECT * FROM users WHERE Age = 25 OR Gender = ‘F’
db.users.find({$or:[{Age: 25, Gender: "F"}]})

Returns all records from the users table/collection whose Gender value is set to F or Age is 25.

SELECT * FROM users WHERE Age > 25
db.users.find({ Age:{$gt: 25}})

Returns all records from the users table/collection whose Age value is greater than 25.

SELECT * FROM users WHERE Age <= 25
db.users.find({ Age:{$lte: 25}})

Returns all records from the users table/collection whose Age value is less than or equal to 25.

SELECT Name FROM users WHERE Name like "He%"
db.users.find(
  { Name: /He/ }
)

Returns all records from the users table/collection whose Name value happens to have He letters.

SELECT * FROM users WHERE Gender = ‘F’ ORDER BY id ASC
db.users.find( { Gender: "F" } ).sort( { $natural: 1 } )

Returns all records from the users table/collection whose Gender value is set to F and sorts this result in the ascending order of the id column in case of MySQL and time inserted in the case of MongoDB.

SELECT * FROM users WHERE Gender = ‘F’ ORDER BY id DESC
db.users.find( { Gender: "F" } ).sort( { $natural: -1 } )

Returns all records from the users table/collection whose Gender value is set to F and sorts this result in the descending order of the id column in case of MySQL and time inserted in the case of MongoDB.

SELECT COUNT(*) FROM users
db.users.count()

or

db.users.find().count()

Counts all records in the users table/collection.

SELECT COUNT(Name) FROM users
db.users.count({Name:{ $exists: true }})

or

db.users.find({Name:{ $exists: true }}).count()

Counts all records in the users table/collection who happen to have a value for the Name property.

SELECT * FROM users LIMIT 1
db.users.findOne()

or

db.users.find().limit(1)

Returns the first record in the users table/collection.

SELECT * FROM users WHERE Gender = ‘F’ LIMIT 1
db.users.find( { Gender: "F" } ).limit(1)

Returns the first record in the users table/collection that happens to have Gender value equal to F.

SELECT * FROM users LIMIT 5 SKIP 10
db.users.find().limit(5).skip(10)

Returns the five records in the users table/collection after skipping the first five records.

UPDATE users SET Age = 26 WHERE age > 25
db.users.updateMany(
  { age: { $gt: 25 } },
  { $set: { Age: 26 } }
)

This sets the age of all records in the users table/collection who have the age greater than 25 to 26.

UPDATE users SET age = age + 1
db.users.updateMany(
  {} ,
  { $inc: { age: 1 } }
)

This increases the age of all records in the users table/collection by 1.

UPDATE users SET age = age - 1
WHERE id = 1
db.users.updateMany(
  {} ,
  { $inc: { age: -1 } }
)

This decrements the age of the first record in the users table/collection by 1.

To manage MySQL and/or MongoDB centrally and from a single point, visit: https://severalnines.com/product/clustercontrol.

Basic Administration Comparison Between Oracle, MSSQL, MySQL, PostgreSQL

$
0
0

The introduction of DevOps in organizations has changed the development process and also introduced some new challenges. In addition, developers and DevOps teams, along with their own chosen programming languages, also have their favorite database systems.

The product life cycle is getting shorter each year so developers want to be able to develop fast, using technologies they know best.

Having multiple RDBMS database backends means your organization will become more agile on the development side, but it also imposes additional knowledge on the operation teams.

Extending your infrastructure from one to many databases implies you have to also monitor, manage and scale them.

As every storage backend excels at different use cases, this also means you have to reinvent the wheel for every one of them.

Knowing the similarities and key differences will help you to immerse into different flavors of RDBMS.

In this article we will go through the following points:

  • A brief introduction to the platform
    • Oracle, MSSQL, MySQL , PostgreSQL
  • Platform support
  • Installation process
  • Database access
  • Backup process
  • Controlling query execution
  • Security
  • Replication options
  • Community support

A brief introduction to the platform

PostgreSQL is for many recognized as the world's most advanced open source database. It is a fully open source database system released under its own license, the PostgreSQL License, comparable to the MIT or BSD licenses. The PostgreSQL community is active and continuously improving existing and new features. As per the DB-engine popularity rank, PostgreSQL was the DBMS of the year 2017 and 2018. The DB-Engines popularity shows that the trend didn’t change over the years.

An interesting fact is that PostgreSQL didn’t support SQL until 1994. The QUEL language was used to query data from it. SQL support was added later on.

PostgreSQL has many advanced features that other enterprise database management systems offer, such as such as views, stored procedures, indexes, and triggers in addition to the primary key, foreign key and atomicity features.

PostgreSQL can be extended by users by modifying existing features, adding new features and distributed freely as it is open-source. It runs on major platforms such as UNIX, MacOS, Windows, and Linux etc. It supports video, text, audio, images, programming interfaces for different languages. The list of supported languages includes C/C++, Java, Python, Perl etc.

Oracle is one of the largest vendors of RDBMS (relational database management system) in the IT world. It is known as an Oracle database, Oracle DB or Oracle marketed by Oracle.

Oracle Database is being used by many companies in the IT industry for transaction processing, business analytics, business intelligence application purpose, etc..

Oracle has a long and very interesting history:

On 16th June 1977 Software Development Laboratories (SDL) was created in Santa Clara, California by Larry Ellison, Bob Miner, and Ed Oates. In 1977 Oracle took its name from the CIA project codename and the irst commercialized Oracle RDBMS is shown to the world in 1979.

Oracle database is available in different editions such as Enterprise edition Standard edition, Express edition, and Oracle Lite. The biggest competitor for Oracle database is the Microsoft SQL server.

Microsoft SQL Server is a very popular RDBMS with restrictive licensing and modest cost of ownership if the database is of significant size, or is used by a significant number of clients.

It's one of the three market-leading database technologies, along with Oracle Database and IBM's DB2.

It provides a very user-friendly interface and easy to learn, which has resulted in a large installed user base.

Like other RDBMS software, Microsoft SQL Server is built on top of SQL, a standardized programming language that database administrators (DBAs) and other IT professionals use to manage databases and query the data they contain. SQL Server is tied to Transact-SQL (T-SQL), an implementation of SQL from Microsoft that adds a set of proprietary programming extensions to the standard language.

MySQL

MySQL is an Oracle-backed open source relational database management system based on SQL.

Originally conceived by the Swedish company MySQL AB, MySQL was acquired by Sun Microsystems in 2008 and then by Oracle when it bought Sun in 2010.

Developers can use MySQL under the GNU General Public License (GPL). The Enterprise version comes with support and additional features for security and high availability.

It's the second most popular database in the world according to db-engines ranking and probably the most present database backend on the planet as it runs most of the internet services around the globe. MySQL runs on virtually all platforms, including Linux, UNIX, and Windows.

MySQL is an important component of an open source enterprise stack called LAMP.

LAMP is a web development platform that uses Linux as the operating system, Apache as the web server, MySQL as the relational database management system and PHP as the object-oriented scripting language.

Platform support

Oracle

The most popular version of Oracle DB, Oracle 12c is a truly enterprise RDBMS system which is supported on a variety of operating systems and platforms. Oracle dominates the database world in part because it runs on dozens of platforms, everything from a Mainframe, Sparc, Mac to Intel. The list includes following OS and architecture combinations: Linux on x86-64 (only Red Hat Enterprise Linux, Oracle Linux, and SUSE distributions are supported) Microsoft Windows on x86-64. Oracle Solaris on SPARC and x86-64. IBM AIX on POWER Systems. Linux on IBM zEnterprise Systems HP-UX on Itanium.

MSSQL

Being a Microsoft product, SQL was designed to be very much compatible with Windows OS. On November 16, 2016, Microsoft announced the beginning of a new story: SQL Server is now supported on Linux and Docker. Hell freezes over!

MySQL

MYSQL carries out smoother execution on all platforms like Microsoft, UNIX, Linux, Mac etc.

PostgreSQL

In general, PostgreSQL can be expected to work on various (even exotic) CPU architectures and operating systems.

It includes CPU architectures like x86, x86_64, IA64, PowerPC, PowerPC 64, S/390, S/390x, Sparc, Sparc 64, Alpha, ARM, MIPS, MIPSEL, M68K, and PA-RISC. It is often possible to build on an unsupported CPU type by configuring with --disable-spinlocks, but performance will be poor.

PostgreSQL can be expected to work on the following operating systems: Linux (all recent distributions), Windows (Win2000 SP4 and later), FreeBSD, OpenBSD, NetBSD, Mac OS X, AIX, HP/UX, IRIX, Solaris, Tru64 Unix, and UnixWare.

Installation Process

Oracle

From all four presented databases systems, Oracle has the most complex system requirements which comes with a complex installation process. On both Windows and Linux based platforms Oracle uses a dedicated Oracle Universal Installer (OUI) tool as the main installation process. The OUI is used to install the Oracle Database software. OUI is a graphical user interface utility that enables you to:

  • View the Oracle software that is installed on your machine
  • Install new Oracle Database software
  • Delete Oracle software that is no longer required.

During the installation process, OUI will start the Oracle Database Configuration Assistant (DBCA) which can install a pre-created default database that contains example schemas or can guide you through the process of creating and configuring a customized database.
 

Oracle OUI - installation interface

If you do not create a database during installation, you can invoke DBCA after you have installed the software, to create one or more databases.

MSSQL

Beginning with SQL Server 2016 (13.x), SQL Server is only available as a 64-bit application.

Installation happens via the Installation Wizard, a command prompt, or through sysprep tool.

The Installation Wizard runs the SQL Server Installation Center. To create a new installation of SQL Server, select the Installation option on the left side, and then click New SQL Server stand-alone installation or add features to an existing installation.

The Linux based installation is very similar to the open source database installation method. It supports packaging for Debian and RedHat based systems. The steps consist of repository configuration, package installation and post-installation configuration, quite similar to MySQL. The whole process is greatly described in the following article.

MSSQL Installation Wizard


MySQL

Oracle provides a set of binary distributions of MySQL. These include generic binary distributions in the form of compressed tar files (files with a .tar.gz extension) for a number of platforms, and binaries in platform-specific packages. On the Windows platform, the installation process is triggered by the standard installation wizard via GUI.

PostgreSQL

PostgreSQL is available in a majority of Linux distributions so it’s very likely you can install it through a simple yum or apt-get command. For the HA configuration, you can use the ClusterControl s9s tool or GUI. S9S tools can help you to create a PostgreSQL cluster with just one single line command:

$ s9s cluster \
--create \
--cluster-type=postgresql \
--nodes="192.168.0.91?master;192.168.0.92?slave;192.168.0.93?slave" \
--provider-version='11' \
--db-admin='postgres' \
--db-admin-passwd='s3cr3tP455' \
--os-user=root \
--os-key-file=/root/.ssh/id_rsa \
--cluster-name='PostgreSQL 11 Streaming Replication' \
--wait
Creating PostgreSQL Cluster
\ Job 259 RUNNING    [█▋        ]  15% Installing helper packages

For more information, check this blog.

Access to the database and DB creation

Oracle

Oracle separates the process of the binary and database creation. Unlike other popular database systems, database creation involves much more steps.

The Database Configuration Assistant (DBCA) is the preferred way to create a database because it can do it in a much more automated approach. DBCA can be launched by the Oracle Universal Installer (OUI), depending on the type of install that you select. You can also launch DBCA as a standalone tool at any time after Oracle Database Installation.

You can run DBCA in interactive mode or non-interactive/silent mode. Interactive mode provides a graphical interface and guided workflow for creating and configuring a database. Non-interactive/silent mode enables you to script the database creation. You can run DBCA in non-interactive/silent mode by specifying command-line arguments, a response file or both.

Oracle DBCA - database creation

When a database is created you can access it with a dedicated client called sqlplus. SQL*Plus is a terminal client program with which you can access Oracle Database.

MSSQL

SQL Server Management Studio (SSMS) is the main tool for administering the Database Engine and writing Transact-SQL code. SSMS is available as a free download from the Microsoft Download Center. The latest version can be used with older versions of the Database Engine.

Management Studio is a preferred method to create a new database. To create a database in Microsoft SQL Server, connect to the computer where Microsoft SQL Server is installed using an administrator account.
Start Microsoft SQL Server Management Studio and choose to create a database option. The wizard process will walk you through the process. If you prefer command line this can be done with CREATE DATABASE syntax.

MySQL

In order to access your MySQL database use mysql client. The database creation is as simple as CREATE DATABASE <name>.

PostgreSQL

PostgreSQL database has the option for multiple ‘schemas’ which operate similarly to databases in MySQL.

Schemas contain the tables, indexes, etc, and can be accessed simultaneously by the same connection to the database that houses them. Access methods for PostgreSQL are defined in a file: pg_hba.conf. It can be located in various places. On Ubuntu 14.04 it is located in /etc/postgresql/9.3/main/pg_hba.conf, on Centos 7 on the other hand it’s located by default in /var/lib/pgsql/data/pg_hba.conf.

ClusterControl
Single Console for Your Entire Database Infrastructure
Find out what else is new in ClusterControl

Backup process

Oracle

Oracle has the most complex, dedicated built-in backup tool of all four servers described here; it’s called Recovery Manager (RMAN).

RMAN allows you to run sophisticated backup policies and selective restores. The same operations usually require a lot of manual steps in other RDBMS.

We can take backups in two ways:

  • disabling the database and copying physical files (so-called cold backup)
  • using RMAN and make a backup without disabling the database (hot backup)

To make a hot backup, set the base in ARCHIVELOG mode. This will tell Oracle to not keep the copy of redo log files as an archivelogs.

MSSQL

In the MS SQL world, you can use the built-in T-SQL commands to backup and restore databases. There is no need to use tools like mysqlhotcopy and mysqldump.

MS SQL Server offers three different online backup strategies:

  • Simple Recovery Model (ALTER DATABASE dbname SET RECOVERY SIMPLE)
  • Full Recovery Model (ALTER DATABASE dbname SET RECOVERY FULL)
  • Bulk-Logged Recovery Model (ALTER DATABASE dbname SET RECOVERY BULK_LOGGED)

The recommended model is the full recovery if no data loss is acceptable. This mode is similar to the MySQL feature when the binary log is enabled. You can recover the database to any point of time, but you should regularly back up the transaction log as well as the database.

The bulk-logged model can be used for large bulk operations such as importing data or creating indexes on big tables. It’s rather less common method to run a database, especially production. It does not support point-in-time recovery so it is generally used as a temporary solution.

The Simple model is useful when the database is rarely updated or for testing and development purposes. In SIMPLE mode, the transaction log of the database is cut each time after the transaction is completed. In the other modes, the log is truncated via CHECKPOINT statement or after the transaction backup file. In case the database is damaged, only the most recent backup can be recovered and all changes since this backup are lost.

MySQL

Two most popular backup utilities are available for MySQL and MariaDB, namely mysqldump logical backup and binary backup Percona XtraBackup and MariaBackup (a fork of Percona XtraBackup). MySQL Enterprise version offers also mysqlbackup which is similar to XtraBackup and MariaBackup hot backup tools.

PostgreSQL

Most DBMS's provide some built-in backup tools. PostgreSQL has pg_dump and pg_dumpall out of the box. However, you may want to use some other tools for your production databases. More information can be found in the top backup tools for PostgreSQL article.

Controlling Query execution and concurrency support

Oracle

In Oracle, all the database objects are grouped by schemas. Schemas are collection of database objects and all the database objects are shared among all schemas and users. It can be translated to MySQL databases. Even though it is all shared, each user can be limited to certain schemas and tables via roles and permissions. This concept is quite similar to MySQL databases.Hi

MSSQL

MS SQL Server organizes all objects, such as tables, views, and procedures, by database names. Users are assigned to a log in, which is granted access to the specific database and its objects. Also, in SQL Server each database has a private, unshared disk file on the server.

MySQL

MySQL only has MVCC support in InnoDB. It is a storage engine and by default is available in MySQL. It also provides ACID-complaint features like foreign key support and transaction handling. By default, each query is treated as a separate transaction, which is a different approach than in Oracle DB.

PostgreSQL

Postgres engine performs concurrency control by using a method called MVCC (Multiversion Concurrency Control). For every user connected to the database, the Postgres database gives a snapshot of the database at a particular instance. When the database must to update an item, it will add the newer version and point the old version as obsolete. It allows the database to save overhead but requires a regulated sweep to delete the old, outdated data.

Security

Oracle

Security features are great, the system provides multi-layered security including controls to evaluate risks, prevent unauthorized data disclosure, detect and report on database activities and enforce data access controls.

MSSQL

Security features are modest, the RDBMS offers fewer features than Oracle but still much more than Open Source database systems.

MySQL

MySQL implements security based on Access Control Lists (ACLs) for all connections, queries, and other operations that a user may attempt to perform. There is also some support for SSL-encrypted connections between MySQL clients and servers.

PostgreSQL

PostgreSQL has ROLES and inherited roles to set and maintain permissions. PostgreSQL has native SSL support for connections to encrypt client/server communications. It also has Row Level Security.
In addition to this, PostgreSQL comes with a built-in enhancement called SE-PostgreSQL which provides additional access controls based on SELinux security policy. More details here.

Community Support

Oracle

Oracle database, similarly to MySQL, has a large community, mostly organized around https://community.oracle.com and passionate groups in any locations around the world like for example https://poug.org/en/. The paid support gives you access to the support group previously known as metalink, not support.oracle.com.

MSSQL

Compared to other database systems, MSSQL probably has the least organized community groups but still very active. Microsoft does a great job in promoting its products in the universities. This gives young developers, devops and DBAs easy access to the technology (free licenses) and any necessary materials.

MySQL

MySQL has a large community of contributors who, particularly following the acquisition by Oracle, focus mainly on maintaining existing features with some new features emerging occasionally. The advantage over other open source databases is a very strong external vendor eco-system. Companies like MariaDB and Percona not only offer great support but also contribute by adding enterprise features into their open source versions.

PostgreSQL

PostgreSQL has a very strong and active community. Its community improves existing features while its innovative committers strive to ensure it remains the most advanced database with new features and security, limiting the distance between Oracle and MSSQL databases. PostgreSQL is known for having more features than other RDBMS on the market.

Replication options

Oracle

Oracle offers logical and physical replication through a built-in Oracle Data Guard. It is an enterprise feature.
Data Guard is a Ship Redo / Apply Redo technology, "redo" is the information needed to recover transactions.

A production database referred to as a primary database broadcasts redo to one or more replicas referred to as standby databases. When an insert or update is made to a table, this change is captured by the log writer into an archive log, and replicated to the standby system.

Standby databases are in a continuous phase of recovery, verifying and applying redo to maintain synchronization with the primary database. A standby database will also automatically re-synchronize if it becomes temporarily disconnected to the primary database due to power outages, network problems, etc.

For more flexible replication options like multisource, selective replication you should consider an extra paid tool, Oracle Golden Gate.

MSSQL

Microsoft SQL Server provides the following types of replication for use in distributed applications:

  • Transactional replication
  • Merge replication
  • Snapshot replication

It can be greatly extended with Microsoft Integration Services, giving you an option to customize the replication flow out of the box.

PostgreSQL

PostgreSQL has several options available, each with its own pros and cons, depending on what is needed through replication. The build options are based on Write Ahead Log. Files are shipped to a standby server where they are read and replayed, or Streaming Replication, where a read-only standby server fetches transaction logs over a database connection to replay them. In the case of a more sophisticated replication architecture, you would probably like to check Slony (master to multiple slaves) or Bucardo (multimaster).

MySQL

MySQL Replication is probably the most popular high availability solution for MySQL,
and widely used by top web services.

It is easy to set up but ongoing maintenance like software upgrades, schema changes, topology changes, failover and recovery have always been tricky.

MySQL replication does not require any third party tools, both master-slave and multimaster can be done out of the box.

The recent versions of MySQL added multi source replication and Global transaction id which make it even more reliable and easier to maintain.

Conclusion

Priority databases like Oracle and MSSQL offer robust management systems and fine support. Among the long list of supported features, users can get the reassuring feeling of access to enterprise support and paid knowledge systems.

On the other side, the cost of the license, not that big of a feature gap and enterprise plugins, will make you eager to shift to the open source decision easier than ever.

Using predefined processes and automation can not only save you time but also protect you from common mistakes.

A management platform that systematically addresses all the different aspects of the database lifecycle will be more robust than patching together a number of point solutions.

Monitoring Your Databases with MySQL Enterprise Monitor

$
0
0

How to Monitor MySQL Databases?

Operational visibility is a must in any production environment. It is crucial to be able to identify any issues as soon as possible, otherwise you may end up in serious troubles as an undetected issue can cause serious service disruption or downtime. MySQL Enterprise Monitor is one of the oldest monitoring products for MySQL on the market, and is available as part of an commercial enterprise subscription agreement from Oracle.In this blog post we will take a look at MySQL Enterprise Monitor and the kind of insight it provides into MySQL.

Installation

First of all, MySQL Enterprise Monitor is part of MySQL Enterprise Edition, a commercial offering from Oracle. It comes in multiple versions of packages, for different operating systems. The installation on Windows 10 (the system we tested on) is pretty much straightforward. MySQL Enterprise Monitor is configured and some bundled services will be installed (MySQL, Tomcat). The tool can be accessed via the browser.

Initial Configuration

First of all, you have to add hosts you would like to monitor.

You can either add single hosts or a batch of them. The dialog window looks the same except that when adding in bulk, you can pass a comma-separated list of servers.

We won’t go into details, but in short you have to define from which host the MySQL instances should be monitored - typically it will be the host on which you installed MySQL Enterprise Monitor. You can also setup agents on your MySQL instances, in that case they will be able to collect data for the host as well, not only MySQL metrics. Then you need to define how to reach the monitored instance (IP address/hostname, user and password). MySQL Enterprise Monitor will then create additional users for tasks like monitoring, which does not require superuser privileges. If you want, you can also configure SSL communication if that’s what the MySQL instance uses, you can also define some timeouts and if a replication topology should be auto-detected or not.

What is also important to keep in mind is that MySQL Enterprise Monitor relies heavily on Performance Schema - make sure your databases have PS enabled, otherwise you will not benefit from a significant part of the features of MySQL Enterprise Monitor.

Monitoring

Once the monitored MySQL instances are configured, you can start to look at the collected data. The Overview section gives you a short summary of some of the most important metrics in MySQL. Data is aggregated and it makes it easier to find any unexpected patterns and then dig further into what happened.

Events tab gives an overview of different issues or events reported by the MySQL Enterprise Monitor and its advisors. You can click at any of the events and read what it is all about, as well as any recommended steps to take:

In this particular case it seems like some queries are doing full table scans and it is recommended to investigate it further to pinpoint such queries and see if they can be optimized.

Another example, here we see that table cache is not configured in an optimal way. You can see the explanation of the problem, advice and recommended actions to take based on this alert.

Metrics

In this tab we can see data for multiple MySQL metrics that are helpful to understand the state of the system.

Timeseries Graphs

Screenshots above are just an example, there are many more graphs to look at.

It is possible to apply filtering: you can define which graphs you would like to see, you can also define what time range should be shown. On top of that, you can just mark a part of the graph and either zoom into it or open the Query Analyzer with data from that particular time:

We will go through this functionality later but in short, it allows you to analyze queries, how their performance changed in time and some example queries.

ClusterControl
Single Console for Your Entire Database Infrastructure
Find out what else is new in ClusterControl

Table Statistics

This tab gives us insight into table statistics: how the traffic looked like (rows fetched, inserted, updated, deleted) and how the latency looked like for all the row operations.

User Statistics

In this tab MySQL Enterprise Monitor presents data about users - statements executed, latency, table scans, I/O latency, connections, memory utilization. This data should give quite a good insight into which user is responsible for the load on the database. It might be very useful especially in the multi-user environments, where there is no one main source of the traffic.

Database File I/O

Database File I/O explains how the I/O load is distributed across the files in the database. Total number of I/O operations, latency, how many reads and writes were performed on a given file.

Memory Usage

Memory usage shows memory structures in MySQL, which help to build the better picture of the memory utilization in the database. This data can come handy in case of issues with memory - it is easy to track where the growth is the biggest and, if needed, reduce relevant settings. It can also help significantly in diagnosing potential memory leaks.

InnoDB Buffer Pool

This tab in MySQL Enterprise Monitor gives the user insight into the structure of the buffer pool utilization. Which tables are cached, how many dirty pages are there to flush?

Queries

It is extremely important for any MySQL user to understand the load that queries create. Which queries are the most problematic? How they behave in time? Performance can be measured in multiple ways but it is quite common that it is the predictable, stable performance is more important than the top performance. As long as the response time is acceptable, users will like the predictable results better than somewhat faster response (low latency), which can sometimes slow the server down significantly. That’s why it is very valuable to see how a query behaves in time and pinpoint those, which behavior is not consistent.

MySQL Enterprise Monitor definitely delivers such data. On the list of the queries, you can easily see how the latency changed in time. Flat line is good, spikes - not so much. This means such query may have to be investigated further. When you click on it, MySQL Enterprise Monitor will give you more data about it.

As you can see, there are some statistical data about the particular query type, you can also see how the latency changed in time. At the bottom you can see some example statements in time and you can compare their execution time.

When you click on one of them, you will see a full query that was executed at that moment. It can be useful in case of queries where the performance differs depending on what arguments were used in WHERE case (for example, WHERE some_column = ‘some value’ and values in that column are not distributed evenly across the rows).

Replication

In a MySQL replication environment, lag is something you have to learn to deal with. What is important is to keep the track of it - how badly are slaves lagging? How often does it happen? With this information it is possible to try and pinpoint the issue and understand better what queries are causing it. Then you can try to implement some improvements like, for example, multi-threaded replication and track if the changes improved the replication performance and reduced the lag to an acceptable level.

How is MySQL Enterprise Monitor Different from ClusterControl

As we stated, MySQL Enterprise Monitor is a part of the paid MySQL Enterprise Edition. For all users of the MySQL Community, MariaDB or Percona Server, MySQL Enterprise Edition is not available. ClusterControl provides access to monitoring of MySQL in its free Community version. In terms of server and query monitoring, there are many similarities.

ClusterControl gives you access to MySQL metrics collected and stored in the Prometheus time-series database. You can easily keep track of numerous metrics made available in ClusterControl.

ClusterControl also comes with a list of advisors, which can be used to keep track of the health and performance of the database. You can also easily create new advisors using the Developer Studio:

If you are interested in query performance, ClusterControl provides a Query Monitor for you - executed queries are collected and their performance is compared making it easy for the user to pinpoint which queries use the most of the CPU on the database.

You can see statistic data on the queries - executions, rows sent and examined, execution time. You can also check the explain plan for a particular query type.

Monitoring Polyglot Persistence

One big difference is the ability to monitor all the main variants of the MySQL ecosystem (Oracle MySQL, MariaDB and Percona Server), different clustering technologies (NDB Cluster, Group Replication, asynchronous replication and Galera Cluster), load balancers/proxies (HAProxy, Keepalived, Maxscale, ProxySQL) as well as other open source databases (PostgreSQL and MongoDB).

Automation and Management

ClusterControl also provides functionality to deploy single instances or clusters on-prem or in the cloud (AWS, GCE and Azure), as well as features like backup management, automatic failover and recovery/repair, rolling upgrades, cluster management for replication or cluster setups, scaling, etc.

That’s all for today folks. If you have worked with MySQL Enterprise Monitor and would like to add something, please do so in the comments section.

How to Migrate MySQL from Amazon EC2 to your On-Prem Data Center Without Downtime

$
0
0

Since the concept of cloud was born, there has been strong growth in the number of migrations to this environment. However, not everything that shines is gold.

As the demand grows, so does the costs. We can find ourselves in a situation where our monthly cloud expenses are very high and, in this case, it may make sense to migrate back to an on-prem environment.

The costs may not be the only reason. There might be security or compliance requirements, or we may need to have more control of our systems. Knowing what happens at a lower level can help us better optimize things.

AWS not only give us the environment, it also provides us with monitoring and management tools to run our system in the cloud. So, it can be really hard to migrate to an on-prem environment and recreate all these tools to manage our systems in the same way.

In this blog, we will see how we can migrate our systems from AWS to an on-prem datacenter, and how ClusterControl can help us in the process.

Concepts

First of all, let’s see some basic concepts about Amazon Cloud.

AWS

Amazon Web Services (AWS) is an Infrastructure as a Service platform, comprising a large number of independent and semi-independent services. The purpose of Infrastructure as a Service platform is to offer, on a commodity basis, services that previously required the purchase of capital-intensive infrastructure components such as high-end servers, network routers and switches, and for larger enterprises, even their own datacenters.

RDS

Amazon Relational Database Service (RDS) makes it easy to set up, operate, and scale a relational database in the cloud. It provides cost-efficient and resizable capacity while automating time-consuming administration tasks such as hardware provisioning, database setup, patching and backups.

Amazon RDS is available on several database instance types and provides you with six familiar database engines to choose from, including Amazon Aurora, PostgreSQL, MySQL, MariaDB, Oracle Database, and SQL Server.

EC2

Amazon Elastic Compute Cloud (EC2) is a service that provides secure, resizable compute capacity in the cloud. It is designed to make web-scale cloud computing easier for developers.

Amazon EC2’s simple web interface allows you to obtain and configure capacity with minimal friction. It provides you with complete control of your computing resources and lets you run on Amazon’s proven computing environment.

ClusterControl

ClusterControl is a comprehensive management system for open source databases that automates deployment and management functions, as well as health and performance monitoring. There are two versions: Community Edition or Enterprise Edition. ClusterControl supports deployment, management, monitoring and scaling for different database technologies on any environment.

Why Migrate?

As we mentioned at the beginning, the most common reasons to migration from AWS to an on-premise environment would be costs, security, compliance, or even working with running local applications. In AWS, we don’t know what is happening under the hood of the infrastructure. We only know that all is working. In cases where you experience poor performance or other anomalies, the only solution is to get in contact with Amazon support.

Example Migration Scenario

In AWS we have two different products related to this blog: EC2 and RDS.

The main difference between them is that in EC2 you have SSH access to the server and have to manage the database yourself. RDS is a hosted database service, and you only have access to the database instance.

In RDS, as you don’t have SSH access, you need to create a dump and import it into the new server, or you can configure replication and promote the slave to the new master. For both options, the process is manual. Also, you can add some load balancer to improve this process. We covered this task in these blogs: Part 1 and Part 2.

So, let focus on the migration from EC2.

In our example, let’s see how to migrate MySQL from AWS EC2 to an on-prem datacenter. We will use a MySQL Replication environment, but these steps should work for other technologies like PostgreSQL.

We will assume that you have your main MySQL database running on EC2 instance. In the on-prem datacenter, we assume you have ClusterControl installed, as well as a fresh database server to migrate to.

In the AWS console, you should have something like this in the EC2 instances section:

AWS EC2 Section
AWS EC2 Section

First, we’ll import our current master running on EC2 to ClusterControl. For this import process, you must open the port 3306 by editing the Security Group associated with the EC2 instance.

AWS Security Group
AWS Security Group

After this, within ClusterControl, go to the Import section.

ClusterControl Import Section 1

There, you can choose the technology, in our example MySQL Replication, and we must specify User, Key or Password and port to connect by SSH to our server. We also need the name for our new replication ‘cluster’.

ClusterControl Import Section 2

After setting up the SSH access information, we must define some database information like the database user, version and basedir. Also, we can enable the ClusterControl Node AutoRecovery and Cluster AutoRecovery features for the new cluster.

Then, we need to add our server by using the IP address or hostname and press Import.

ClusterControl Import Section 3
ClusterControl
Single Console for Your Entire Database Infrastructure
Find out what else is new in ClusterControl

We can monitor the status of the import of our setup from the ClusterControl activity monitor.

Once the task is finished, we can see our master in the main ClusterControl screen.

Make sure that you have enabled the binlog generation in your current master database. If not, you can enable it from the Node Action section in ClusterControl.

Now, we can add our future new master as a new replica from our current master database. For this, go to ClusterControl -> Select Cluster -> Cluster Actions -> Add Replication Slave.

ClusterControl Add Replication Slave

Here, we need to add the hostname or IP address of the new slave server, and if we want ClusterControl to install the software for us.

Make sure that you have connectivity from AWS to the port 3306 and 9999 in the on-prem server.

The way ClusterControl stages the slave with data is to take an hotbackup of the master, stream it to the slave and restore it there. Once restored, the slave is connected to the master so it can catch up on events and get in sync. Note that, for large databases running with some load, you might want to avoid the extra load of this operation on the master. In that case, it is possible to build the slave first from an existing backup, and then connect the slave so it catches up with the master.

After this task, we should have something like this:

You can also verify the topology on the ClusterControl Topology section.

ClusterControl Topology View 1

Then, we need to promote the slave to master (ClusterControl -> Select Cluster -> Node Actions -> Promote slave) and change the endpoint in your application.

To improve this topology, you can add a load balancer to manage the traffic from the application server to the database. Using a load balancer, during the migration, you don’t need to change the endpoint from your application. The load balancer will change the master in a transparent way for your application.

ClusterControl Topology View 2

There are many ways to perform this task and, probably you should be able to adapt this strategy or similar, to your environment, depending on your infrastructure, security, etc.

For security reasons, you should consider using a VPN between the AWS and the on-premise environment.

In the case of a multi-master topology like Galera Cluster, you only need to add the nodes that you want on-premise, but be careful with the latency. You can use for example different Galera segments to decrease network usage.

Considerations

Some considerations to take into account when we want to leave AWS and start to use our own environment could be:

  • Monitoring: Don’t forget to use some monitoring system. You need to know what is happening in your system.
  • Disaster Recovery Strategy: You should consider some disaster recovery strategy. In general, you should have the information in three different places, for example, Master, Slave, and backup, each in different physical places.
  • High Availability: Nowadays, HA is a must in most production environments, so we need to think about the best HA solution depending on our infrastructure.
  • Scaling: We should be able to scale if it’s needed in the future or for some specific event.
  • Rollback: If you want to migrate from AWS to an on-premise environment, keep in mind that something could go wrong (as in any type of migration), so you should have some rollback plan.
  • If you are after some kind of hybrid environment, with instances running on AWS and on-prem, then ClusterControl can be a good fit for monitoring, managing availability, backups and scaling.
ClusterControl Overview

How to Migrate from Oracle to MySQL / Percona Server

$
0
0

Migrating from Oracle to MySQL/Percona Server is not a trivial task. Although it is getting easier, especially with the arrival of MySQL 8.0 and Percona announced Percona Server for MySQL 8.0 GA. Aside from planning for your migration from Oracle to Percona Server, you must ensure that you understand the purpose and functionality for why it has to be Percona Server.

This blog will focus on Migrating from Oracle to Percona Server as its specific target database of choice. There's a page in the Oracle website about SQL Developer Supplementary Information for MySQL Migrations which can be used as a reference for the planned migration. This blog will not cover the overall process of migration, as it is a long process. But it will hopefully provide enough background information to serve as a guide for your migration process.

Since Percona Server is a fork of MySQL, almost all features that come along in MySQL are present in Percona Server. So any reference of MySQL here is applicable as well to Percona Server. We previously blogged about migrating Oracle Database to PostgreSQL. I’ll reiterate again the reasons why one would consider migrating from Oracle to an open-source RDBMS such as PostgreSQL or Percona Server/MySQL/MariaDB.

  1. Cost: As you may know Oracle licence cost is very expensive and there is additional cost for some features like partitioning and high availability. So overall it's very expensive.
  2. Flexible open source licensing and easy availability from public cloud providers like AWS.
  3. Benefit from open source add-ons to improve performance.

Planning and Development Strategy

Migration from Oracle going to Percona Server 8.0 can be a pain since there's a lot of key factors that needs to be considered and addressed. For example, Oracle can run on a Windows Server machine but Percona Server does not support Windows. Although you can compile it for Windows, Percona itself does not offer any support for Windows. You must also identify your database architecture requirements, since Percona Server is not designed for OLAP (Online Analytical Processing) or data-warehousing applications. Percona Server/MySQL RDBMS are perfect fit for OLTP (Online Transaction Processing).

Identifying the key aspect of your database architecture, for example if your current Oracle architecture implements MAA (Maximum Available Architecture) with Data Guard ++ Oracle RAC (Real Application Cluster), you should determine its equivalence in Percona Server. There's no straight answer for this within MySQL/Percona Server. However, you can choose from a synchronous replication, an asynchronous replication (Percona XtraDB Cluster is still currently on version 5.7.x), or with Group Replication. Then, there's multiple alternatives that you can implement for your own high-availability solution. For example, (to name a few) using Corosync/Pacemaker/DRBD/Linux stack, or using MHA (MySQL High Availability), or using Keepalived/HaProxy/ProxySQL stack, or plainly rely on ClusterControl which supports Keepalived, HaProxy, ProxySQL, Garbd, and Maxscale for your high-availability solutions.

On the other side, the question you have also to consider as part of the plan is "How will Percona will provide support and who will help us when Percona Server itself encounters a bug or how high is the urgency when we need help?". One thing to consider as well is budget, if the purpose of migration from enterprise database to an open-source RDBMS is because of cost-cutting.

There are different options from migration planning to the things you need to do as part of your development strategy. Such options include engaging with experts in the MySQL/Percona Server field and that includes us here at Severalnines. There are lots of MySQL consulting firms that can help you through this since migration from Oracle to MySQL requires a lot of expertise and know-how in the MySQL Server area. This should not be limited to the database but it should cover expertise in scalability, redundancy, backups, high-availability, security, monitoring/observability, recovery and engaging on mission critical systems. Overall, it should have an understanding of your architectural insight without exposing confidentiality of your data.

Assessment or Preliminary Check

Backing up your data including configurations or setup files, kernel tunings, automation scripts shall not be left into oblivion. It's an obvious task, but before you migrate, always secure everything first , especially when moving to a different platform.

You must assess as well that your applications are following the up-to-date software engineering conventions and ensure that they are platform agnostic. These practices can be to your benefit especially when moving to a different database platform, such as Percona Server for MySQL.

Take note that the operating system that Percona Server requires can be a show-stopper if your application and database run on a Windows Server and the application is Windows dependent; then this could be a lot of work! Always remember that Percona Server is on a different platform: perfection might not be guaranteed but can be achieved close enough.

Lastly, make sure that the targeted hardware is designed to work feasibly with Percona's server requirements or that it is bug-free at least (see here). You may consider stress testing first with Percona Server before reliably moving off your Oracle Database.

What You Should Know

It is worth noting that in Percona Server / MySQL, you can create multiple databases whereas Oracle does not come with that same functionality as MySQL.

In MySQL, physically, a schema is synonymous with a database. You can substitute the keyword SCHEMA instead of DATABASE in MySQL SQL syntax, for example using CREATE SCHEMA instead of CREATE DATABASE; whilst Oracle has a distinction of this. A schema represents only a part of a database: the tables and other objects owned by a single user. Normally, there is a one-to-one relationship between the instance and the database.

For example, in a replication setup equivalent in Oracle (e.g. Real Application Clusters or RAC), you have your multiple instances accessing a single database. This lets you start Oracle on multiple servers, but all accessing the same data. However, in MySQL, you can allow access to multiple databases from your multiple instances and can even filter out which databases/schema you can replicate to a MySQL node.

Referencing from one of our previous blog, the same principle applies when speaking of converting your database with available tools found on the internet.

There is no such tool that can 100% convert Oracle database into Percona Server / MySQL; some of it will be manual work.

Checkout the following sections for things that you must be aware of when it comes to migration and verifying the logical SQL result.

Data Type Mapping

MySQL / Percona Server have a number of data-types that is almost the same as Oracle but not as rich as compared to Oracle. But since the arrival of the 5.7.8 version of MySQL, is supports for a native JSON data type.

Below is its data-type equivalent representation (tabular representation is taken from here):

 OracleMySQL
1BFILEPointer to binary file, ⇐ 4GVARCHAR(255)
2BINARY_FLOAT32-bit floating-point numberFLOAT
3BINARY_DOUBLE64-bit floating-point numberDOUBLE
4BLOBBinary large object, ⇐ 4GLONGBLOB
5CHAR(n), CHARACTER(n)Fixed-length string, 1 ⇐ n ⇐ 255CHAR(n), CHARACTER(n)
6CHAR(n), CHARACTER(n)Fixed-length string, 256 ⇐ n ⇐ 2000VARCHAR(n)
7CLOBCharacter large object, ⇐ 4GLONGTEXT
8DATEDate and timeDATETIME
9DECIMAL(p,s), DEC(p,s)Fixed-point numberDECIMAL(p,s), DEC(p,s)
10DOUBLE PRECISIONFloating-point numberDOUBLE PRECISION
11FLOAT(p)Floating-point numberDOUBLE
12INTEGER, INT38 digits integerINTDECIMAL(38)
13INTERVAL YEAR(p) TO MONTHDate intervalVARCHAR(30)
14INTERVAL DAY(p) TO SECOND(s)Day and time intervalVARCHAR(30)
15LONGCharacter data, ⇐ 2GLONGTEXT
16LONG RAWBinary data, ⇐ 2GLONGBLOB
17NCHAR(n)Fixed-length UTF-8 string, 1 ⇐ n ⇐ 255NCHAR(n)
18NCHAR(n)Fixed-length UTF-8 string, 256 ⇐ n ⇐ 2000NVARCHAR(n)
19NCHAR VARYING(n)Varying-length UTF-8 string, 1 ⇐ n ⇐ 4000NCHAR VARYING(n)
20NCLOBVariable-length Unicode string, ⇐ 4GNVARCHAR(max)
21NUMBER(p,0), NUMBER(p)8-bit integer, 1 <= p < 3TINYINT(0 to 255)
16-bit integer, 3 <= p < 5SMALLINT
32-bit integer, 5 <= p < 9INT
64-bit integer, 9 <= p < 19BIGINT
Fixed-point number, 19 <= p <= 38DECIMAL(p)
22NUMBER(p,s)Fixed-point number, s > 0DECIMAL(p,s)
23NUMBER, NUMBER(*)Floating-point numberDOUBLE
24NUMERIC(p,s)Fixed-point numberNUMERIC(p,s)
25NVARCHAR2(n)Variable-length UTF-8 string, 1 ⇐ n ⇐ 4000NVARCHAR(n)
26RAW(n)Variable-length binary string, 1 ⇐ n ⇐ 255BINARY(n)
27RAW(n)Variable-length binary string, 256 ⇐ n ⇐ 2000VARBINARY(n)
28REALFloating-point numberDOUBLE
29ROWIDPhysical row addressCHAR(10)
30SMALLINT38 digits integerDECIMAL(38)
31TIMESTAMP(p)Date and time with fractionDATETIME(p)
32TIMESTAMP(p) WITH TIME ZONEDate and time with fraction and time zoneDATETIME(p)
33UROWID(n)Logical row addresses, 1 ⇐ n ⇐ 4000VARCHAR(n)
34VARCHAR(n)Variable-length string, 1 ⇐ n ⇐ 4000VARCHAR(n)
35VARCHAR2(n)Variable-length string, 1 ⇐ n ⇐ 4000VARCHAR(n)
36XMLTYPEXML dataLONGTEXT

Data type attributes and options:

OracleMySQL
BYTE and CHAR column size semanticsSize is always in characters
 

Transactions

Percona Server uses XtraDB (an enhanced version of InnoDB) as its primary storage engine for handling transactional data; although various storage engines can be an alternative choice for handling transactions such as TokuDB (deprecated) and MyRocks storage engines.

Whilst there are advantages and benefits to using or exploring MyRocks with XtraDB, the latter is more robust and de facto storage engine that Percona Server is using and its enabled by default, so we'll use this storage engine as the basis for migration with regards to transactions.

By default, Percona Server / MySQL has autocommit variable set to ON which means that you have to explicitly handle transactional statements to take advantage of ROLLBACK for ignoring changes or taking advantage of using SAVEPOINT.

It's basically the same concept that Oracle uses in terms of commit, rollbacks and savepoints.

For explicit transactions, this means that you have to use the START TRANSACTION/BEGIN; <SQL STATEMENTS>; COMMIT; syntax.

Otherwise, if you have to disable autocommit, you have to explicitly COMMIT all the time for your statements that requires changes to your data.

Dual Table

MySQL has the dual compatibility with Oracle which is meant for compatibility of databases using a dummy table, namely DUAL.

This suits Oracle's usage of DUAL so any existing statements in your application that use DUAL might require no changes upon migration to Percona Server.

The Oracle FROM clause is mandatory for every SELECT statement, so Oracle database uses DUAL table for SELECT statement where a table name is not required.

In MySQL, the FROM clause is not mandatory so DUAL table is not necessary. However, the DUAL table does not work exactly the same as it does for Oracle, but for simple SELECT's in Percona Server, this is fine.

See the following example below:

In Oracle,

SQL> DESC DUAL;
 Name                                      Null?    Type
 ----------------------------------------- -------- ----------------------------
 DUMMY                                              VARCHAR2(1)

SQL> SELECT CURRENT_TIMESTAMP FROM DUAL;
CURRENT_TIMESTAMP
---------------------------------------------------------------------------
16-FEB-19 04.16.18.910331 AM +08:00

But in MySQL:

mysql> DESC DUAL;
ERROR 1064 (42000): You have an error in your SQL syntax; check the manual that corresponds to your MySQL server version for the right syntax to use near 'DUAL' at line 1
mysql> SELECT CURRENT_TIMESTAMP FROM DUAL;
+---------------------+
| CURRENT_TIMESTAMP   |
+---------------------+
| 2019-02-15 20:20:28 |
+---------------------+
1 row in set (0.00 sec)

Note: the DESC DUAL syntax does not work in MySQL and the results as well differ as CURRENT_TIMESTAMP (uses TIMESTAMP data type) in MySQL does not include the timezone.

SYSDATE

Oracle's SYSDATE function is almost the same in MySQL.

MySQL returns date and time and is a function that requires () (close and open parenthesis with no arguments required. To demonstrate this below, here's Oracle and MySQL on using SYSDATE.

In Oracle, using plain SYSDATE just returns the date of the day without the time. But to get the time and date, use TO_CHAR to convert the date time into its desired format; whereas in MySQL, you might not need it to get the date and the time as it returns both.

See example below.

In Oracle:

SQL> SELECT TO_CHAR (SYSDATE, 'MM-DD-YYYY HH24:MI:SS') "NOW" FROM DUAL;
NOW
-------------------
02-16-2019 04:39:00

SQL> SELECT SYSDATE FROM DUAL;

SYSDATE
---------
16-FEB-19

But in MySQL:

mysql> SELECT SYSDATE() FROM DUAL;
+---------------------+
| SYSDATE()           |
+---------------------+
| 2019-02-15 20:37:36 |
+---------------------+
1 row in set (0.00 sec)

If you want to format the date, MySQL has a DATE_FORMAT() function.

You can check the MySQL Date and Time documentation for more info.

ClusterControl
Single Console for Your Entire Database Infrastructure
Find out what else is new in ClusterControl

TO_DATE

Oracle's TO_DATE equivalent in MySQL is the STR_TO_DATE() function.

It’s almost identical to the one in Oracle: it returns the DATE data type, while in MySQL it returns the DATETIME data type.

Oracle:

SQL> SELECT TO_DATE ('20190218121212','yyyymmddhh24miss') as "NOW" FROM DUAL; 
NOW
-------------------------
18-FEB-19

MySQL:

mysql> SELECT STR_TO_DATE('2019-02-18 12:12:12','%Y-%m-%d %H:%i:%s') as "NOW" FROM DUAL;
+---------------------+
| NOW                 |
+---------------------+
| 2019-02-18 12:12:12 |
+---------------------+
1 row in set (0.00 sec)

SYNONYM

In MySQL, there's no such support nor any equivalence for SYNONYM in Oracle.

A possible alternative can be possible with MySQL is using VIEW.

Although SYNONYM can be used to create an alias of a remote table,

e.g.

CREATE PUBLIC SYNONYM emp_table FOR hr.employees@remote.us.oracle.com

In MySQL, you can take advantage of using FEDERATED storage engine.

e.g.

CREATE TABLE hr_employees (
    id     INT(20) NOT NULL AUTO_INCREMENT,
    name   VARCHAR(32) NOT NULL DEFAULT '',
    other  INT(20) NOT NULL DEFAULT '0',
    PRIMARY KEY  (id),
    INDEX name (name),
    INDEX other_key (other)
)
ENGINE=FEDERATED
DEFAULT CHARSET=utf8mb4
CONNECTION='mysql://fed_user@remote_host:9306/federated/test_table';

Or you can simplify the process with CREATE SERVER syntax, so that when creating a table acting as your SYNONYM for accessing a remote table, it will be easier. See the documentation for more info on this.

Behaviour of Empty String and NULL

Take note that in Percona Server / MySQL, empty string is not NULL whereas Oracle treats empty string as null values.

In Oracle:

SQL> SELECT CASE WHEN '' IS NULL THEN 'Yes' ELSE 'No' END AS "Null Eval" FROM dual;
Nul
---
Yes

In MySQL:

mysql> SELECT CASE WHEN '' IS NULL THEN 'Yes' ELSE 'No' END AS "Null Eval" FROM dual;
+-----------+
| Null Eval |
+-----------+
| No        |
+-----------+
1 row in set (0.00 sec)

Sequences

In MySQL, there's no exact same approach to what Oracle does for SEQUENCE.

Although there are some posts that are simulating the functionality of this approach, you might be able to try to get the next key using LAST_INSERT_ID() as long as your table's clustered index, PRIMARY KEY, is defined with << is there something missing? >>

Character String Functions

Unlike Oracle, MySQL / Percona Server has a handful of string functions but not as many helpful functions built-in to the database.

It would be too long to discuss it here one-by-one, but you can check the documentation from MySQL and compare this against Oracle's string functions.

DML Statements

Insert/Update/Delete statements from Oracle are congruous in MySQL.

Oracle's INSERT ALL/INSERT FIRST is not supported in MySQL.

Otherwise, you’d need to state your MySQL queries one-by-one.

e.g.

In Oracle:

SQL> INSERT ALL
  INTO CUSTOMERS (customer_id, customer_name, city) VALUES (1000, 'Jase Alagaban', 'Davao City')
  INTO CUSTOMERS (customer_id, customer_name, city) VALUES (2000, 'Maximus Aleksandre Namuag', 'Davao City')
SELECT * FROM dual;
2 rows created.

2 rows created.

But in MySQL, you have to run the insert one at a time:

mysql> INSERT INTO CUSTOMERS (customer_id, customer_name, city) VALUES (1000, 'Jase Alagaban', 'Davao City');
Query OK, 1 row affected (0.02 sec)
mysql> INSERT INTO CUSTOMERS (customer_id, customer_name, city) VALUES (2000, 'Maximus Aleksandre Namuag', 'Davao City');
Query OK, 1 row affected (0.00 sec)

The INSERT ALL/INSERT FIRST doesn’t compare to how it is used in Oracle, where you can take advantage of conditions by adding a WHEN keyword in your syntax; there's no equivalent option in MySQL / Percona Server in this case.

Hence, your alternative solution on this is to use procedures.

Outer Joins "+" Symbol

In Oracle, using + operator for left and right joins is not supported at present in MySQL as + operator is only used for arithmetic decisions.

Hence, if you have + operator in your existing Oracle SQL statements, you need to replace this with LEFT JOIN or RIGHT JOIN.

You might want to check the official documentation for "Outer Join Simplification" of MySQL.

START WITH..CONNECT BY

Oracle uses START WITH..CONNECT BY for hierarchical queries.

Starting with MySQL / Percona 8.0, there is support for generating hierarchical data results which uses models such as adjacency list or nested set models. This is called Common Table Expressions (CTE) in MySQL.

Similar to PostgreSQL, MySQL uses WITH RECURSIVE syntax for hierarchical queries so translate CONNECT BY statement into WITH RECURSIVE statement.

Check down below on how it differs from ORACLE and in MySQL / Percona Server.

In Oracle:

SELECT cp.id, cp.title, CONCAT(c2.title, '> ' || cp.title) as path
FROM category cp INNER JOIN category c2
  ON cp.parent_id = c2.id
WHERE cp.parent_id IS NOT NULL
START WITH cp.id >= 1
CONNECT BY NOCYCLE PRIOR c2.id=cp.parent_id; 

And in MySQL:

WITH RECURSIVE category_path (id, title, path) AS
(
  SELECT id, title, title as path
    FROM category
    WHERE parent_id IS NULL
  UNION ALL
  SELECT c.id, c.title, CONCAT(cp.path, '> ', c.title)
    FROM category_path AS cp JOIN category AS c
      ON cp.id = c.parent_id
)
SELECT * FROM category_path
ORDER BY path;

PL/SQL in MySQL / Percona?

MySQL / Percona RDBMS has a different approach than Oracle's PL/SQL.

MySQL uses stored procedures or stored functions, which is similar to PL/SQL and syntax using BEGIN..END syntax.

Oracle's PL/SQL is compiled before execution when it is loaded into the server, while MySQL is compiled and stored in the cache when it's invoked.

You may want to checkout this documentation as a reference guide on converting your PL/SQL to MySQL.

Migration Tools

I did some research for any tools that could be a de facto standard for migration but I couldn’t find a good answer.

Though, I did find sqlines and it looks simple but promising.

While I didn’t deep-dive into it, the website offers a handful of insights, which could help you on migrating from Oracle to MySQL/Percona Server. There are also paid tools such as this and this.

I've also searched through github but found nothing much more appealing as a resolution to the problem. Hence, if you're aiming to migrate from Oracle and to Amazon, they have AWS Schema Conversion Tool for which migrating from Oracle to MySQL is supported.

Overall, the reason why migration is not an easy thing to do is mainly because Oracle RDBMS is such a beast with lots of features that Percona Server / MySQL or MariaDB RDBMS still do not have.

Anyhow, if you find or know of any tools that you find helpful and beneficial for migrating from Oracle to MySQL / Percona Server, please leave a comment on this blog!

Testing

As part of your migration plan, testing is a vital task that plays a very important role and affects your decision with regards to migration.

The tool dbdeployer (a port of MySQL Sandbox) is a very helpful tool that you can take advantage of. This is pretty easy for you to try and test different approaches and saves you time, rather than setting up the whole stack if your purpose is to try and test the RDBMS platform first.

For testing your SQL stored routines (functions or procedures), triggers, events, I suggest you use these tools mytap or the Google's Unit Testing Framework.

Percona as well offers a number of tools that are available for download on their website. Checkout Percona Toolkit here. You can cherry-pick the tools according to your needs especially for testing and production-usage tasks.

Overall, things that you need to keep-in-mind as your guidelines when doing a test for your MySQL Server are:

  • After your installation, you need to consider doing some tuning. Checkout this Percona blog for help.
  • Do some benchmarks and stress-load testing for your configuration setup on your current node. Checkout mysqlslap and sysbench which can help you with this. Also check out our blog "How to Benchmark Performance of MySQL & MariaDB using SysBench".
  • Check your DDL's if they are correctly defined such as data-types, constraints, clustered and secondary indexes, or partitions, if you have any.
  • Check your DML especially if syntax are correct and are saving the data correctly as expected.
  • Check out your stored routines, events, trigger to ensure they run/return the expected results.
  • Verify that your queries running are performant. I suggest you take advantage of open-source tools or try our ClusterControl product. It offers monitoring/observability especially of your MySQL / Percona Server. You can use ClusterControl here to monitor your queries and its query plan to make sure they are performant.

Hybrid OLTP/Analytics Database Workloads in Galera Cluster Using Asynchronous Slaves

$
0
0

Using Galera cluster is a great way of building a highly available environment for MySQL or MariaDB. It is a shared-nothing cluster environment which can be scaled even beyond 12-15 nodes. Galera has some limitations, though. It shines in low-latency environments and even though it can be used across WAN, the performance is limited by network latency. Galera performance can also be impacted if one of the nodes starts to behave incorrectly. For example, excessive load on one of the nodes may slow it down, resulting in slower handling of the writes and that will impact all of the other nodes in the cluster. On the other hand, it is quite impossible to run a business without analyzing your data. Such analysis, typically, requires running heavy queries, which is quite different from an OLTP workload. In this blog post, we will discuss an easy way of running analytical queries for data stored in Galera Cluster for MySQL or MariaDB, in a way that it does not impact the performance of the core cluster.

How to run analytical queries on Galera Cluster?

As we stated, running long running queries directly on a Galera cluster is doable, but perhaps not so good idea. Hardware-dependant, this can be acceptable solution (if you use strong hardware and you will not run a multi-threaded analytical workload) but even if CPU utilization will not be a problem, the fact that one of the nodes will have mixed workload (OLTP and OLAP) will alone pose some performance challenges. OLAP queries will evict data required for your OLTP workload from the buffer pool, and this will slow down your OLTP queries. Luckily, there is a simple yet efficient way of separating analytical workload from regular queries - an asynchronous replication slave.

Replication slave is a very simple solution - all you need is just another host which can be provisioned and asynchronous replication has to be configured from Galera Cluster to that node. With asynchronous replication, the slave will not impact the rest of the cluster in any way. No matter if it is heavily loaded, uses different (less powerful) hardware, it will just continue replicating from the core cluster. The worst case scenario is that the replication slave will start lagging behind but then it is up to you to implement multi-threaded replication or, eventually to scale up the replication slave.

Once the replication slave is up and running, you should run the heavier queries on it and offload the Galera cluster. This can be done in multiple ways, depending on your setup and environment. If you use ProxySQL, you can easily direct queries to the analytical slave based on the source host, user, schema or even the query itself. Otherwise it will be up to your application to send analytical queries to the correct host.

Setting up a replication slave is not very complex but it still can be tricky if you are not proficient with MySQL and tools like xtrabackup. The whole process would consist of setting up the repository on a new server and installing the MySQL database. Then you will have to provision that host using data from Galera cluster. You can use xtrabackup for that but other tools like mydumper/myloader or even mysqldump will work as well (as long as you execute them correctly). Once the data is there, you will have to setup the replication between a master Galera node and the replication slave. Finally, you would have to reconfigure your proxy layer to include the new slave and route the traffic towards it or make tweaks in how your application connects to the database in order to redirect some of the load to the replication slave.

What is important to keep in mind, this setup is not resilient. If the “master” Galera node would go down, the replication link will be broken and it will take a manual action to slave the replica off another master node in the Galera cluster.

This is not a big deal, especially if you use replication with GTID (Global Transaction ID) but you have to identify that the replication is broken and then take the manual action.

How to set up the asynchronous slave to Galera Cluster using ClusterControl?

Luckily, if you use ClusterControl, the whole process can be automated and it requires just a handful of clicks. The initial state has already been set up using ClusterControl - a 3 node Galera cluster with 2 ProxySQL nodes and 2 Keepalived nodes for high availability of both database and proxy layer.

Adding the replication slave is just a click away:

Replication, obviously, requires binary logs to be enabled. If you do not have binlogs enabled on your Galera nodes, you can do it also from the ClusterControl. Please keep in mind that enabling binary logs will require a node restart to apply the configuration changes.

Even if one node in the cluster has binary logs enabled (marked as “Master” on the screenshot above), it’s still good to enable binary log on at least one more node. ClusterControl can automatically failover the replication slave after it detects that the master Galera node crashed, but for that, another master node with binary logs enabled is required or it won’t have anything to fail over to.

As we stated, enabling binary logs requires restart. You can either perform it straight away, or just make the configuration changes and perform the restart at some other time.

After binlogs have been enabled on some of the Galera nodes, you can proceed with adding the replication slave. In the dialog you have to pick the master host, pass the hostname or IP address of the slave. If you have recent backups at hand (which you should do), you can use one to provision the slave. Otherwise ClusterControl will provision it using xtrabackup - all the recent master data will be streamed to the slave and then the replication will be configured.

After the job completed, a replication slave has been added to the cluster. As stated earlier, should the 10.0.0.101 die, another host in the Galera cluster will be picked as the master and ClusterControl will automatically slave 10.0.0.104 off another node.

As we use ProxySQL, we need to configure it. We’ll add a new server into ProxySQL.

We created another hostgroup (30) where we put our asynchronous slave. We also increased “Max Replication Lag” to 50 seconds from default 10. It is up to your business requirements how badly analytics slave can be lagging before it becomes a problem.

After that we have to configure a query rule that will match our OLAP traffic and route it to the OLAP hostgroup (30). On the screenshot above we filled several fields - this is not mandatory. Typically you will need to use one, two of them at most. Above screenshot serves as an example so we can easily see that you can match queries using schema (if you have a separate schema with analytical data), hostname/IP (if OLAP queries are executed from some particular host), user (if application uses particular user for analytical queries. You can also match queries directly by either passing a full query or by marking them with SQL comments and let ProxySQL route all queries with a “OLAP_QUERY” string to our analytical hostgroup.

As you can see, thanks to ClusterControl we were able to deploy a replication slave to Galera Cluster in just a couple of clicks. Some may argue that MySQL is not the most suitable database for analytical workload and we tend to agree. You can easily extend this setup using ClickHouse and by setting up a replication from asynchronous slave to ClickHouse columnar datastore for much better performance of analytical queries. We described this setup in one of the earlier blog posts.

MongoDB vs MySQL NoSQL - Why Mongo is Better

$
0
0

There are so many database management systems (DBMS) to choose from ranging from relational to non-relational DBMS. In the past years, the Relational DBMS where more dominant but with recent data structure trends the non-relational DBMS are becoming more popular. The choices for relational DBMS are quite obvious: MySQL, PostgreSQL and MS SQL. On the other hand, MongoDB a non-relational DBM has come to rise basically due to its ability to handle a large set of data. Every selection has got its pros and cons but your choice will mainly be determined by your application needs since both serve in different niches. However, in this article, we are going to discuss the pros of using MongoDB over MySQL.

Pros of Using MongoDB Over MySQL

  1. Speed and performance
  2. High Availability and Cloud Computing
  3. Schema Flexibility
  4. Need to grow bigger
  5. Embedding feature
  6. Security Model
  7. Location-based data
  8. Rich query language support

Speed and Performance

This is one of the major benefits of using MongoDB over MySQL especially when a large set of unstructured data is involved. MongoDB by default encourages high insert rate over transaction safety. This feature is not available in MySQL hence for instance if you are to save a lot of data to your DBM at once, in the case of MySQL you will have to do it one by one. But in the case of MongoDB, with the availability of insertMany() function, you can safely do the multiple inserts. Observing some of the querying behaviours of the two, we can summarize the different operation requests for 1 million documents in the illustration below.

In the case of updating which is a write operation, MongoDB takes 0.002 seconds to update all student emails whereas MySQL takes 0.2491s to execute the same task.

From the illustration, we can conclude that MongoDB takes way lesser time than MySQL for the same operations. MongoDB is mainly structured such that documents are the basis of storage which promotes huge query and data storage. This implies that the performance is dependent on two key values that are the design and scale out. On the other hand, MySQL has data stored in an individual table hence at some point one has to lookup on the entire table before doing a write operation.

High Availability and Cloud Computing

For unstable environments, MongoDB provides a better handling technique than MySQL. This is because it takes very less time for the active secondary nodes to elect a new primary node thus easy administration at the point of failure. Besides, due to comprehensive secondary indexes and native replication, creating a backup for a MongoDB database is quite easy as compared to MySQL since the latter has integrated replication support.

In a nutshell, setting a set of servers that can act as Master-Slaves is easy and fast in MongoDB than MySQL. Besides, recovery from a cluster failure is instant, automatic and safe. For MySQL, there is no clear official solution for providing failover between master and slave in the event of a failure.

Cloud-based storage solutions require data to be smoothly spread across various server to scale up. MongoDB can load a high volume of data as compared to MySQL and with built-in sharding, it is easy to partition and spread out data across multiple servers as a way of utilizing the cost-saving solution as per the cloud-based storage merits.

Schema Flexibility

MongoDB is schemaless such that different documents in the same collection may have the same or different fields from each other. This means there is no restriction on document structure for every insert or update hence changes to the data model won’t have much impact. Of course, there are scenarios that can opt one to use undefined schema for example if you are de-normalizing a database schema or when your database is growing but your schema is unstable. MongoDB therefore allows one to add various types of data as per needs change.

On the other hand, MySQL is table oriented whereby each row must have the same columns as the other rows. Adding a new column would require one to run an ALTER operation which is quite expensive in terms of performance as it will have to lock up the entire database. This is especially the case when the table grows over 10GB, MongoDB does not have this issue.

With a flexible schema it is easy to develop and maintain a cleaner code. Besides, MongoDB provides the option of using a JSON validator in case you want to ensure some data integrity and consistency for your collection hence you can do some validation before insert or update of a document.

The Need to Grow Bigger

Databases scaling is not an easy undertaking especially with MySQL it may result in degraded performance when the 5-10GB per table memory is surpassed. With MongoDB, this is not an issue since one can partition and shard the database with the In-built sharding feature. Once a shard key is specified and sharding is enabled, data is partitioned evenly according to the shard key. If a new shard is added, there is automatic rebalancing. Sharding basically allows horizontal scaling which is difficult to implement in MySQL. Besides, MongoDB has got built-in replication whereby replica sets create multiple copies of the data. Each member of this set has a role either as primary or secondary at any point in the process.

Reads and writes are done on the primary and then replicated to the secondaries. With this merit in place, in case of data inconsistency or instance failure, a new member may be voted in to act as primary.

Embedding Feature

Unlike MySQL where you cannot embed data to a field, MongoDB offers a better embedding technique for related data. As much as you can do a JOIN for tables in MySQL, you may end up having so many tables with some being unnecessary especially if they don’t involve so many fields. In the case of MongoDB you can decide to embed data into a field for related data or reference from another collection if you expect the document grow in future beyond the JSON document size.

For example if we have data for users who we want to capture their addresses and some other information, in the case of MongoDB we can easily have a simple structure like

{
    id:1,
    name:'George Bush',
    gender: 'Male',
    age:45,
    address:{
        City: 'New York',
        Street: 'Florida',
        Zip_code: 1342243
    }
}

But in the case of MySQL we will have to make 2 tables with an id referencing in this case. I.e

Users details table

idnamegenderage
1George BushMale45

User address table

idCityStreetZip_code
1George BushMale134224

In MySQL you will have so many tables which could be so hectic to deal with especially when scaling is involved. As much as one can also do a table join in a single query when fetching this data in MySQL, the latency is quite larger as compared to MongoDB and this is one of the reasons that makes the performance of MongoDB outdo the performance of MySQL.

Severalnines
 
Become a MongoDB DBA - Bringing MongoDB to Production
Learn about what you need to know to deploy, monitor, manage and scale MongoDB

Security Model

Database administration (DBA) is quite essential in MySQL but not necessary in the case of MongoDB. This means you need to have the DBA to modify a schema in the case of MySQL when an application changes. On the other hand, one can do schema modification without DBA in MongoDB since it is great for class persistence and a class can equally be serialized to JSON and stored. However, this is the best practice if you don’t expect the data to grow big otherwise you will need to follow some best practices to avoid pitfalls.

Location Based Data

In order to improve on throughput operations especially read operations, MongoDB provides built-in special functions that enhance finding relevant data from specific locations which are accurate hence fastening the process. This is not possible in the case of MySQL.

Rich Query Language Support

On a personal interest as a MongoDB enthusiast, I got my attraction with flexibility on querying feature of MongoDB. Regarding the aggregation framework in the later versions and MapReduce feature, one can optimize the result data to suit own specifications. As much as MySQL also offers operations such as grouping, sorting and many more, MongoDB is quite extensive especially with embedded data structures. Further as mentioned early, queries are returned with lesser latency in the aggregation framework than when a JOIN was to be done in the case of MySQL. For instance, MongoDB offers an easy way of modifying a schema using the $set and $unset operations for the embedded schema. But, in the case of MySQL, one has to do the ALTER command for the only table within which the field exists and this is quite expensive in terms of performance.

Conclusion

Regarding the merits discussed above, as much as database selection absolutely depends on application design MongoDB offers a lot of flexibility along different lines. If you are looking for something that will cater for better performance, dealing with complex data hence no need restrictions on schema design, future expectations on database growth and rich query language technique, I would recommend you to go for MongoDB.

A Review of the New Analytic Window Functions in MySQL 8.0

$
0
0

Data is captured and stored for a variety of reasons. Hours beyond count (and even more budget) invested in collecting, ingesting, structuring, validating, and ultimately storing of data; to say that it is a valuable asset is to drive home a moot point. This day in age it may, in fact, be our most precious commodity.

Some data is used strictly as an archive. Perhaps to record or track events that happened in the past. But the other side of that coin is that historical data has value in basing decisions for the future and future endeavors.

  • What day to have our sale on? (Planning for future sales based on how we did in the past.)
  • Which salesperson performed the best in quarter one? (Looking back, who can we reward for their efforts.)
  • Which restaurant is frequented the most in the middle of July? (The travel season is upon us... Who can we sell our foodstuffs and goods to?)

You get the picture. Using data on hand is integral for any organization.

Many companies build, base, and provide services with data. They depend on it.

Several months back, depending on when you are reading this, I began walking for exercise, in earnest, to lose weight, get a handle on my health, and to seek a daily bit of solitude from this busy world we live in.

I used a mobile pedometer app to track my hikes, even considering which shoes I wore, as I have a tendency to be ultra-picky when it comes to footwear.

While this data is not nearly as important as that mentioned in those scenarios above, for me, a key element in learning anything, is using something I am interested in, can relate to, and understand.

Window Functions have been on my radar to explore for a long while now. So, I thought to try my hand at a couple of them in this post. Having recently been supported in MySQL 8 (Visit this Severalnines blog I wrote about MySQL 8 upgrades and new additions where I mention them briefly) that ecosystem is the one I will use here. Be forewarned, I am not a window analytical function guru.

What is a MySQL Window Function?

The MySQL documentation defines them as such:"A window function performs an aggregate-like operation on a set of query rows. However, whereas an aggregate operation groups query rows into a single result row, a window function produces a result for each query row:"

Data Set and Setup for This Post

I store the captured data from my walks in this table:

mysql> DESC hiking_stats;
+-----------------+--------------+------+-----+---------+-------+
| Field           | Type         | Null | Key | Default | Extra |
+-----------------+--------------+------+-----+---------+-------+
| day_walked      | date         | YES  |     | NULL    |       |
| burned_calories | decimal(4,1) | YES  |     | NULL    |       |
| distance_walked | decimal(4,2) | YES  |     | NULL    |       |
| time_walking    | time         | YES  |     | NULL    |       |
| pace            | decimal(2,1) | YES  |     | NULL    |       |
| shoes_worn      | text         | YES  |     | NULL    |       |
| trail_hiked     | text         | YES  |     | NULL    |       |
+-----------------+--------------+------+-----+---------+-------+
7 rows in set (0.01 sec)

There is close to 90 days worth of data here:

mysql> SELECT COUNT(*) FROM hiking_stats;
+----------+
| COUNT(*) |
+----------+
|       84 |
+----------+
1 row in set (0.00 sec)

I'll admit, I am finicky about my footwear so let's determine which pair of shoes I favored most:

mysql> SELECT DISTINCT shoes_worn, COUNT(*)
    -> FROM hiking_stats
    -> GROUP BY shoes_worn;
+---------------------------------------+----------+
| shoes_worn                            | COUNT(*) |
+---------------------------------------+----------+
| New Balance Trail Runners-All Terrain |       30 |
| Oboz Sawtooth Low                     |       47 |
| Keen Koven WP(keen-dry)               |        6 |
| New Balance 510v2                     |        1 |
+---------------------------------------+----------+
4 rows in set (0.00 sec)

In order to provide a better, manageable on-screen demonstration, I will limit the remaining portion of query results to just those of the favorite shoes I wore 47 times.

I also have a trail_hiked column and since I was in 'ultra exercise mode' during this almost 3 month period, I even counted calories while push mowing the yard:

mysql> SELECT DISTINCT trail_hiked, COUNT(*)
    -> FROM hiking_stats
    -> GROUP BY trail_hiked;
+------------------------+----------+
| trail_hiked            | COUNT(*) |
+------------------------+----------+
| Yard Mowing            |       14 |
| Sandy Trail-Drive      |       20 |
| West Boundary          |       29 |
| House-Power Line Route |       10 |
| Tree Trail-extended    |       11 |
+------------------------+----------+
5 rows in set (0.01 sec)

Yet, to even further limit the data set, I will filter out those rows as well:

mysql> SELECT COUNT(*)
    -> FROM hiking_stats
    -> WHERE shoes_worn = 'Oboz Sawtooth Low'
    -> AND
    -> trail_hiked <> 'Yard Mowing';
+----------+
| COUNT(*) |
+----------+
|       40 |
+----------+
1 row in set (0.01 sec)

For the sake of simplicity and ease of use, I will create a VIEW of columns to work with:

mysql> CREATE VIEW vw_fav_shoe_stats AS
    -> (SELECT day_walked, burned_calories, distance_walked, time_walking, pace, trail_hiked
    -> FROM hiking_stats
    -> WHERE shoes_worn = 'Oboz Sawtooth Low'
    -> AND trail_hiked <> 'Yard Mowing');
Query OK, 0 rows affected (0.19 sec)

Leaving me with this set of data:

mysql> SELECT * FROM vw_fav_shoe_stats;
+------------+-----------------+-----------------+--------------+------+------------------------+
| day_walked | burned_calories | distance_walked | time_walking | pace | trail_hiked            |
+------------+-----------------+-----------------+--------------+------+------------------------+
| 2018-06-03 |           389.6 |            4.11 | 01:13:19     |  3.4 | Sandy Trail-Drive      |
| 2018-06-04 |           394.6 |            4.26 | 01:14:15     |  3.4 | Sandy Trail-Drive      |
| 2018-06-06 |           384.6 |            4.10 | 01:13:14     |  3.4 | Sandy Trail-Drive      |
| 2018-06-07 |           382.7 |            4.12 | 01:12:52     |  3.4 | Sandy Trail-Drive      |
| 2018-06-17 |           296.3 |            2.82 | 00:55:45     |  3.0 | West Boundary          |
| 2018-06-18 |           314.7 |            3.08 | 00:59:13     |  3.1 | West Boundary          |
| 2018-06-20 |           338.5 |            3.27 | 01:03:42     |  3.1 | West Boundary          |
| 2018-06-21 |           339.5 |            3.40 | 01:03:54     |  3.2 | West Boundary          |
| 2018-06-24 |           392.4 |            3.76 | 01:13:51     |  3.1 | House-Power Line Route |
| 2018-06-25 |           362.1 |            3.72 | 01:08:09     |  3.3 | West Boundary          |
| 2018-06-26 |           380.5 |            3.94 | 01:11:36     |  3.3 | West Boundary          |
| 2018-07-03 |           323.7 |            3.29 | 01:00:55     |  3.2 | West Boundary          |
| 2018-07-04 |           342.8 |            3.47 | 01:04:31     |  3.2 | West Boundary          |
| 2018-07-06 |           375.7 |            3.80 | 01:10:42     |  3.2 | West Boundary          |
| 2018-07-07 |           347.6 |            3.40 | 01:05:25     |  3.1 | Sandy Trail-Drive      |
| 2018-07-08 |           351.6 |            3.58 | 01:06:09     |  3.2 | West Boundary          |
| 2018-07-09 |           336.0 |            3.28 | 01:03:13     |  3.1 | West Boundary          |
| 2018-07-11 |           375.2 |            3.81 | 01:10:37     |  3.2 | West Boundary          |
| 2018-07-12 |           325.9 |            3.28 | 01:01:20     |  3.2 | West Boundary          |
| 2018-07-15 |           382.9 |            3.91 | 01:12:03     |  3.3 | House-Power Line Route |
| 2018-07-16 |           368.6 |            3.72 | 01:09:22     |  3.2 | West Boundary          |
| 2018-07-17 |           339.4 |            3.46 | 01:03:52     |  3.3 | West Boundary          |
| 2018-07-18 |           368.1 |            3.72 | 01:08:28     |  3.3 | West Boundary          |
| 2018-07-19 |           339.2 |            3.44 | 01:03:06     |  3.3 | West Boundary          |
| 2018-07-22 |           378.3 |            3.76 | 01:10:22     |  3.2 | West Boundary          |
| 2018-07-23 |           322.9 |            3.28 | 01:00:03     |  3.3 | West Boundary          |
| 2018-07-24 |           386.4 |            3.81 | 01:11:53     |  3.2 | West Boundary          |
| 2018-07-25 |           379.9 |            3.83 | 01:10:39     |  3.3 | West Boundary          |
| 2018-07-27 |           378.3 |            3.73 | 01:10:21     |  3.2 | West Boundary          |
| 2018-07-28 |           337.4 |            3.39 | 01:02:45     |  3.2 | Sandy Trail-Drive      |
| 2018-07-29 |           348.7 |            3.50 | 01:04:52     |  3.2 | West Boundary          |
| 2018-07-30 |           361.6 |            3.69 | 01:07:15     |  3.3 | West Boundary          |
| 2018-07-31 |           359.9 |            3.66 | 01:06:57     |  3.3 | West Boundary          |
| 2018-08-01 |           336.1 |            3.37 | 01:01:48     |  3.3 | West Boundary          |
| 2018-08-03 |           259.9 |            2.57 | 00:47:47     |  3.2 | West Boundary          |
| 2018-08-05 |           341.2 |            3.37 | 01:02:44     |  3.2 | West Boundary          |
| 2018-08-06 |           357.7 |            3.64 | 01:05:46     |  3.3 | West Boundary          |
| 2018-08-17 |           184.2 |            1.89 | 00:39:00     |  2.9 | Tree Trail-extended    |
| 2018-08-18 |           242.9 |            2.53 | 00:51:25     |  3.0 | Tree Trail-extended    |
| 2018-08-30 |           204.4 |            1.95 | 00:37:35     |  3.1 | House-Power Line Route |
+------------+-----------------+-----------------+--------------+------+------------------------+
40 rows in set (0.00 sec)

The first window function I will look at is ROW_NUMBER().

Suppose I want a result set ordered by the burned_calories column for the month of 'July'.

Of course, I can retrieve that data with this query:

mysql> SELECT day_walked, burned_calories, trail_hiked
    -> FROM vw_fav_shoe_stats
    -> WHERE MONTHNAME(day_walked) = 'July'
    -> ORDER BY burned_calories DESC;
+------------+-----------------+------------------------+
| day_walked | burned_calories | trail_hiked            |
+------------+-----------------+------------------------+
| 2018-07-24 |           386.4 | West Boundary          |
| 2018-07-15 |           382.9 | House-Power Line Route |
| 2018-07-25 |           379.9 | West Boundary          |
| 2018-07-22 |           378.3 | West Boundary          |
| 2018-07-27 |           378.3 | West Boundary          |
| 2018-07-06 |           375.7 | West Boundary          |
| 2018-07-11 |           375.2 | West Boundary          |
| 2018-07-16 |           368.6 | West Boundary          |
| 2018-07-18 |           368.1 | West Boundary          |
| 2018-07-30 |           361.6 | West Boundary          |
| 2018-07-31 |           359.9 | West Boundary          |
| 2018-07-08 |           351.6 | West Boundary          |
| 2018-07-29 |           348.7 | West Boundary          |
| 2018-07-07 |           347.6 | Sandy Trail-Drive      |
| 2018-07-04 |           342.8 | West Boundary          |
| 2018-07-17 |           339.4 | West Boundary          |
| 2018-07-19 |           339.2 | West Boundary          |
| 2018-07-28 |           337.4 | Sandy Trail-Drive      |
| 2018-07-09 |           336.0 | West Boundary          |
| 2018-07-12 |           325.9 | West Boundary          |
| 2018-07-03 |           323.7 | West Boundary          |
| 2018-07-23 |           322.9 | West Boundary          |
+------------+-----------------+------------------------+
22 rows in set (0.01 sec)

Yet, for whatever reason (maybe personal satisfaction), I want to award a ranking among the returned rows beginning with 1 indicative of the highest burned_calories count, all the way to (n) rows in the result set.

ROW_NUMBER(), can handle this no problem at all:

mysql> SELECT day_walked, burned_calories,
    -> ROW_NUMBER() OVER(ORDER BY burned_calories DESC)
    -> AS position, trail_hiked
    -> FROM vw_fav_shoe_stats
    -> WHERE MONTHNAME(day_walked) = 'July';
+------------+-----------------+----------+------------------------+
| day_walked | burned_calories | position | trail_hiked            |
+------------+-----------------+----------+------------------------+
| 2018-07-24 |           386.4 |        1 | West Boundary          |
| 2018-07-15 |           382.9 |        2 | House-Power Line Route |
| 2018-07-25 |           379.9 |        3 | West Boundary          |
| 2018-07-22 |           378.3 |        4 | West Boundary          |
| 2018-07-27 |           378.3 |        5 | West Boundary          |
| 2018-07-06 |           375.7 |        6 | West Boundary          |
| 2018-07-11 |           375.2 |        7 | West Boundary          |
| 2018-07-16 |           368.6 |        8 | West Boundary          |
| 2018-07-18 |           368.1 |        9 | West Boundary          |
| 2018-07-30 |           361.6 |       10 | West Boundary          |
| 2018-07-31 |           359.9 |       11 | West Boundary          |
| 2018-07-08 |           351.6 |       12 | West Boundary          |
| 2018-07-29 |           348.7 |       13 | West Boundary          |
| 2018-07-07 |           347.6 |       14 | Sandy Trail-Drive      |
| 2018-07-04 |           342.8 |       15 | West Boundary          |
| 2018-07-17 |           339.4 |       16 | West Boundary          |
| 2018-07-19 |           339.2 |       17 | West Boundary          |
| 2018-07-28 |           337.4 |       18 | Sandy Trail-Drive      |
| 2018-07-09 |           336.0 |       19 | West Boundary          |
| 2018-07-12 |           325.9 |       20 | West Boundary          |
| 2018-07-03 |           323.7 |       21 | West Boundary          |
| 2018-07-23 |           322.9 |       22 | West Boundary          |
+------------+-----------------+----------+------------------------+
22 rows in set (0.00 sec)

You can see the row with burned_calories amount of 386.4 has position 1, while the row with value 322.9 has 22, which is the least (or lowest) amount among the returned rows set.

I'll use ROW_NUMBER() for something a bit more interesting as we progress. Only when I learned about it used in that context, did I truly realize some of its real power.

Up next, let's visit the RANK() window function to provide a different sort of 'ranking' among the rows. We will still target the burned_calories column value. And, while RANK() is similar to ROW_NUMBER() in that they somewhat rank rows, it does introduce a subtle difference in certain circumstances.

I will even further limit the number of rows as a whole by filtering any records not in the month of 'July' but targeting a specific trail:

mysql> SELECT day_walked, burned_calories,
    -> RANK() OVER(ORDER BY burned_calories DESC) AS position,
    -> trail_hiked
    -> FROM vw_fav_shoe_stats
    -> WHERE MONTHNAME(day_walked) = 'July'
    -> AND trail_hiked = 'West Boundary';
+------------+-----------------+----------+---------------+
| day_walked | burned_calories | position | trail_hiked   |
+------------+-----------------+----------+---------------+
| 2018-07-24 |           386.4 |        1 | West Boundary |
| 2018-07-25 |           379.9 |        2 | West Boundary |
| 2018-07-22 |           378.3 |        3 | West Boundary |
| 2018-07-27 |           378.3 |        3 | West Boundary |
| 2018-07-06 |           375.7 |        5 | West Boundary |
| 2018-07-11 |           375.2 |        6 | West Boundary |
| 2018-07-16 |           368.6 |        7 | West Boundary |
| 2018-07-18 |           368.1 |        8 | West Boundary |
| 2018-07-30 |           361.6 |        9 | West Boundary |
| 2018-07-31 |           359.9 |       10 | West Boundary |
| 2018-07-08 |           351.6 |       11 | West Boundary |
| 2018-07-29 |           348.7 |       12 | West Boundary |
| 2018-07-04 |           342.8 |       13 | West Boundary |
| 2018-07-17 |           339.4 |       14 | West Boundary |
| 2018-07-19 |           339.2 |       15 | West Boundary |
| 2018-07-09 |           336.0 |       16 | West Boundary |
| 2018-07-12 |           325.9 |       17 | West Boundary |
| 2018-07-03 |           323.7 |       18 | West Boundary |
| 2018-07-23 |           322.9 |       19 | West Boundary |
+------------+-----------------+----------+---------------+
19 rows in set (0.01 sec)

Notice anything odd here? Different from ROW_NUMBER()?

Check out the position value for those rows of '2018-07-22' and '2018-07-27'. They are in a tie at 3rd.

With good reason since the burned_calorie value of 378.3 is present in both rows.

How would ROW_NUMBER() rank them?

Let's find out:

mysql> SELECT day_walked, burned_calories,
    -> ROW_NUMBER() OVER(ORDER BY burned_calories DESC) AS position,
    -> trail_hiked
    -> FROM vw_fav_shoe_stats
    -> WHERE MONTHNAME(day_walked) = 'July'
    -> AND trail_hiked = 'West Boundary';
+------------+-----------------+----------+---------------+
| day_walked | burned_calories | position | trail_hiked   |
+------------+-----------------+----------+---------------+
| 2018-07-24 |           386.4 |        1 | West Boundary |
| 2018-07-25 |           379.9 |        2 | West Boundary |
| 2018-07-22 |           378.3 |        3 | West Boundary |
| 2018-07-27 |           378.3 |        4 | West Boundary |
| 2018-07-06 |           375.7 |        5 | West Boundary |
| 2018-07-11 |           375.2 |        6 | West Boundary |
| 2018-07-16 |           368.6 |        7 | West Boundary |
| 2018-07-18 |           368.1 |        8 | West Boundary |
| 2018-07-30 |           361.6 |        9 | West Boundary |
| 2018-07-31 |           359.9 |       10 | West Boundary |
| 2018-07-08 |           351.6 |       11 | West Boundary |
| 2018-07-29 |           348.7 |       12 | West Boundary |
| 2018-07-04 |           342.8 |       13 | West Boundary |
| 2018-07-17 |           339.4 |       14 | West Boundary |
| 2018-07-19 |           339.2 |       15 | West Boundary |
| 2018-07-09 |           336.0 |       16 | West Boundary |
| 2018-07-12 |           325.9 |       17 | West Boundary |
| 2018-07-03 |           323.7 |       18 | West Boundary |
| 2018-07-23 |           322.9 |       19 | West Boundary |
+------------+-----------------+----------+---------------+
19 rows in set (0.06 sec)

Hmmm...

No ties in the position column numbering this time.

But, who gets precedence?

To my knowledge, for a predictable ordering, you will likely have to determine it by some other additional means within the query (e.g. the time_walking column in this case?).

But we are not done yet with ranking options. Here is DENSE_RANK():

mysql> SELECT day_walked, burned_calories,
    -> DENSE_RANK() OVER(ORDER BY burned_calories DESC) AS position,
    -> trail_hiked
    -> FROM vw_fav_shoe_stats
    -> WHERE MONTHNAME(day_walked) = 'July'
    -> AND trail_hiked = 'West Boundary';
+------------+-----------------+----------+---------------+
| day_walked | burned_calories | position | trail_hiked   |
+------------+-----------------+----------+---------------+
| 2018-07-24 |           386.4 |        1 | West Boundary |
| 2018-07-25 |           379.9 |        2 | West Boundary |
| 2018-07-22 |           378.3 |        3 | West Boundary |
| 2018-07-27 |           378.3 |        3 | West Boundary |
| 2018-07-06 |           375.7 |        4 | West Boundary |
| 2018-07-11 |           375.2 |        5 | West Boundary |
| 2018-07-16 |           368.6 |        6 | West Boundary |
| 2018-07-18 |           368.1 |        7 | West Boundary |
| 2018-07-30 |           361.6 |        8 | West Boundary |
| 2018-07-31 |           359.9 |        9 | West Boundary |
| 2018-07-08 |           351.6 |       10 | West Boundary |
| 2018-07-29 |           348.7 |       11 | West Boundary |
| 2018-07-04 |           342.8 |       12 | West Boundary |
| 2018-07-17 |           339.4 |       13 | West Boundary |
| 2018-07-19 |           339.2 |       14 | West Boundary |
| 2018-07-09 |           336.0 |       15 | West Boundary |
| 2018-07-12 |           325.9 |       16 | West Boundary |
| 2018-07-03 |           323.7 |       17 | West Boundary |
| 2018-07-23 |           322.9 |       18 | West Boundary |
+------------+-----------------+----------+---------------+
19 rows in set (0.00 sec)

The tie remains, however, the numbering is different in where rows are counted, continuing through the remaining results.

Where RANK() began the count with 5 after the ties, DENSE_RANK() picks up at the next number, which is 4 in this instance, since the tie happened at row 3.

I'll be the first to admit, these various row ranking patterns are quite interesting, but, how can you use them for a meaningful result set?

ClusterControl
Single Console for Your Entire Database Infrastructure
Find out what else is new in ClusterControl

A Bonus Thought

I have to give credit where credit is due. I learned so much about window functions from a wonderful series on YouTube and one video, in particular, inspired me for this next example. Please keep in mind although the examples in that series are demonstrated with a non-open-source database system (Don't toss the digital rotten fruits and veggies at me), there is a ton to learn from the videos overall.

I see a pattern in most of the query results so far I want to explore. I will not filter by any month nor trail.

What I want to know, are the consecutive days that I burned more than 350 calories. Better yet, groups of those days.

Here is the base query I will start with and build off from:

mysql> SELECT day_walked, burned_calories, 
    -> ROW_NUMBER() OVER(ORDER BY day_walked ASC) AS positional_bound, 
    -> trail_hiked 
    -> FROM vw_fav_shoe_stats 
    -> WHERE burned_calories > 350;
+------------+-----------------+------------------+------------------------+
| day_walked | burned_calories | positional_bound | trail_hiked            |
+------------+-----------------+------------------+------------------------+
| 2018-06-03 |           389.6 |                1 | Sandy Trail-Drive      |
| 2018-06-04 |           394.6 |                2 | Sandy Trail-Drive      |
| 2018-06-06 |           384.6 |                3 | Sandy Trail-Drive      |
| 2018-06-07 |           382.7 |                4 | Sandy Trail-Drive      |
| 2018-06-24 |           392.4 |                5 | House-Power Line Route |
| 2018-06-25 |           362.1 |                6 | West Boundary          |
| 2018-06-26 |           380.5 |                7 | West Boundary          |
| 2018-07-06 |           375.7 |                8 | West Boundary          |
| 2018-07-08 |           351.6 |                9 | West Boundary          |
| 2018-07-11 |           375.2 |               10 | West Boundary          |
| 2018-07-15 |           382.9 |               11 | House-Power Line Route |
| 2018-07-16 |           368.6 |               12 | West Boundary          |
| 2018-07-18 |           368.1 |               13 | West Boundary          |
| 2018-07-22 |           378.3 |               14 | West Boundary          |
| 2018-07-24 |           386.4 |               15 | West Boundary          |
| 2018-07-25 |           379.9 |               16 | West Boundary          |
| 2018-07-27 |           378.3 |               17 | West Boundary          |
| 2018-07-30 |           361.6 |               18 | West Boundary          |
| 2018-07-31 |           359.9 |               19 | West Boundary          |
| 2018-08-06 |           357.7 |               20 | West Boundary          |
+------------+-----------------+------------------+------------------------+
20 rows in set (0.00 sec)

We've seen ROW_NUMBER() already, however now it really comes into play.

To make this work (in MySQL at least) I had to use the DATE_SUB() function since essentially, with this technique we are subtracting a number - the value provided by ROW_NUMBER() from the day_walked date column of the same row, which in turn, provides a date itself via the calculation:

mysql> SELECT day_walked AS day_of_walk,
    -> DATE_SUB(day_walked, INTERVAL ROW_NUMBER() OVER(ORDER BY day_walked ASC) DAY) AS positional_bound,
    -> burned_calories,
    -> trail_hiked
    -> FROM vw_fav_shoe_stats
    -> WHERE burned_calories > 350;
+-------------+------------------+-----------------+------------------------+
| day_of_walk | positional_bound | burned_calories | trail_hiked            |
+-------------+------------------+-----------------+------------------------+
| 2018-06-03  | 2018-06-02       |           389.6 | Sandy Trail-Drive      |
| 2018-06-04  | 2018-06-02       |           394.6 | Sandy Trail-Drive      |
| 2018-06-06  | 2018-06-03       |           384.6 | Sandy Trail-Drive      |
| 2018-06-07  | 2018-06-03       |           382.7 | Sandy Trail-Drive      |
| 2018-06-24  | 2018-06-19       |           392.4 | House-Power Line Route |
| 2018-06-25  | 2018-06-19       |           362.1 | West Boundary          |
| 2018-06-26  | 2018-06-19       |           380.5 | West Boundary          |
| 2018-07-06  | 2018-06-28       |           375.7 | West Boundary          |
| 2018-07-08  | 2018-06-29       |           351.6 | West Boundary          |
| 2018-07-11  | 2018-07-01       |           375.2 | West Boundary          |
| 2018-07-15  | 2018-07-04       |           382.9 | House-Power Line Route |
| 2018-07-16  | 2018-07-04       |           368.6 | West Boundary          |
| 2018-07-18  | 2018-07-05       |           368.1 | West Boundary          |
| 2018-07-22  | 2018-07-08       |           378.3 | West Boundary          |
| 2018-07-24  | 2018-07-09       |           386.4 | West Boundary          |
| 2018-07-25  | 2018-07-09       |           379.9 | West Boundary          |
| 2018-07-27  | 2018-07-10       |           378.3 | West Boundary          |
| 2018-07-30  | 2018-07-12       |           361.6 | West Boundary          |
| 2018-07-31  | 2018-07-12       |           359.9 | West Boundary          |
| 2018-08-06  | 2018-07-17       |           357.7 | West Boundary          |
+-------------+------------------+-----------------+------------------------+
20 rows in set (0.00 sec)

However, without DATE_SUB(), you wind up with this (or at least I did):

mysql> SELECT day_walked AS day_of_walk,
    -> day_walked - ROW_NUMBER() OVER(ORDER BY day_walked ASC) AS positional_bound,
    -> burned_calories,
    -> trail_hiked
    -> FROM vw_fav_shoe_stats
    -> WHERE burned_calories > 350;
+-------------+------------------+-----------------+------------------------+
| day_of_walk | positional_bound | burned_calories | trail_hiked            |
+-------------+------------------+-----------------+------------------------+
| 2018-06-03  |         20180602 |           389.6 | Sandy Trail-Drive      |
| 2018-06-04  |         20180602 |           394.6 | Sandy Trail-Drive      |
| 2018-06-06  |         20180603 |           384.6 | Sandy Trail-Drive      |
| 2018-06-07  |         20180603 |           382.7 | Sandy Trail-Drive      |
| 2018-06-24  |         20180619 |           392.4 | House-Power Line Route |
| 2018-06-25  |         20180619 |           362.1 | West Boundary          |
| 2018-06-26  |         20180619 |           380.5 | West Boundary          |
| 2018-07-06  |         20180698 |           375.7 | West Boundary          |
| 2018-07-08  |         20180699 |           351.6 | West Boundary          |
| 2018-07-11  |         20180701 |           375.2 | West Boundary          |
| 2018-07-15  |         20180704 |           382.9 | House-Power Line Route |
| 2018-07-16  |         20180704 |           368.6 | West Boundary          |
| 2018-07-18  |         20180705 |           368.1 | West Boundary          |
| 2018-07-22  |         20180708 |           378.3 | West Boundary          |
| 2018-07-24  |         20180709 |           386.4 | West Boundary          |
| 2018-07-25  |         20180709 |           379.9 | West Boundary          |
| 2018-07-27  |         20180710 |           378.3 | West Boundary          |
| 2018-07-30  |         20180712 |           361.6 | West Boundary          |
| 2018-07-31  |         20180712 |           359.9 | West Boundary          |
| 2018-08-06  |         20180786 |           357.7 | West Boundary          |
+-------------+------------------+-----------------+------------------------+
20 rows in set (0.04 sec)

Hey, that doesn't look so bad really.

What gives?

Eh, the row with a positional_bound value of '20180698'...

Wait a minute, this is supposed to calculate a date value by subtracting the number ROW_NUMBER() provides from the day_of_walk column.

Correct.

I don't know about you, but I am not aware of a month with 98 days!

But, if there is one, bring on the extra paychecks!

All fun aside, this obviously was incorrect and prompted me to (eventually) use DATE_SUB(), which provides a correct, results set then allowing me to run this query:

mysql> SELECT MIN(t.day_of_walk), 
    -> MAX(t.day_of_walk),
    -> COUNT(*) AS num_of_hikes
    -> FROM (SELECT day_walked AS day_of_walk,
    -> DATE_SUB(day_walked, INTERVAL ROW_NUMBER() OVER(ORDER BY day_walked ASC) DAY) AS positional_bound
    -> FROM vw_fav_shoe_stats
    -> WHERE burned_calories > 350) AS t
    -> GROUP BY t.positional_bound
    -> ORDER BY 1;
+--------------------+--------------------+--------------+
| MIN(t.day_of_walk) | MAX(t.day_of_walk) | num_of_hikes |
+--------------------+--------------------+--------------+
| 2018-06-03         | 2018-06-04         |            2 |
| 2018-06-06         | 2018-06-07         |            2 |
| 2018-06-24         | 2018-06-26         |            3 |
| 2018-07-06         | 2018-07-06         |            1 |
| 2018-07-08         | 2018-07-08         |            1 |
| 2018-07-11         | 2018-07-11         |            1 |
| 2018-07-15         | 2018-07-16         |            2 |
| 2018-07-18         | 2018-07-18         |            1 |
| 2018-07-22         | 2018-07-22         |            1 |
| 2018-07-24         | 2018-07-25         |            2 |
| 2018-07-27         | 2018-07-27         |            1 |
| 2018-07-30         | 2018-07-31         |            2 |
| 2018-08-06         | 2018-08-06         |            1 |
+--------------------+--------------------+--------------+
13 rows in set (0.12 sec)

Basically, I have wrapped the results set provided from that analytical query, in the form of a Derived Table, and queried it for: a start and end date, a count of what I have labeled num_of_hikes, then grouped on the positional_bound column, ultimately providing sets of groups of consecutive days where I burned more than 350 calories.

You can see in the date range of 2018-06-24 to 2018-06-26, resulted in 3 consecutive days meeting the calorie burned criteria of 350 in the WHERE clause.

Not too bad if I don't say so myself, but definitely a record I want to try and best!

Conclusion

Window functions are in a world and league of their own. I have not even scratched the surface of them, having only covered 3 of them in a 'high-level' introductory and perhaps, trivial sense. However, hopefully, through this post, you find that you can query for quite interesting and potentially insightful data with a 'bare minimal' use of them.

Thank you for reading.

Dealing with Unreliable Networks When Crafting an HA Solution for MySQL or MariaDB

$
0
0

Long gone are the days when a database was deployed as a single node or instance - a powerful, standalone server which was tasked to handle all the requests to the database. Vertical scaling was the way to go - replace the server with another, even more powerful one. During these times, one didn’t really have to be bothered by network performance. As long as the requests were coming in, all was good.

But nowadays, databases are built as clusters with nodes interconnected over a network. It is not always a fast, local network. With businesses reaching global scale, database infrastructure has also to span across the globe, to stay close to customers and to reduce latency. It comes with additional challenges that we have to face when designing a highly available database environment. In this blog post, we will look into the network issues that you may face and provide some suggestions on how to deal with them.

Two Main Options for MySQL or MariaDB HA

We covered this particular topic quite extensively in one of the whitepapers, but let’s look at the two main ways of building high availability for MySQL and MariaDB.

Galera Cluster

Galera Cluster is shared-nothing, virtually synchronous cluster technology for MySQL. It allows to build multi-writer setups that can span across the globe. Galera thrives in low-latency environments but it can also be configured to work with long WAN connections. Galera has a built-in quorum mechanism which ensures that data will not be compromised in case of the network partitioning of some of the nodes.

MySQL Replication

MySQL Replication can be either asynchronous or semi-synchronous. Both are designed to build large scale replication clusters. Like in any other master-slave or primary-secondary replication setup, there can be only one writer, the master. Other nodes, slaves, are used for failover purposes as they contain the copy of the data set from the maser. Slaves can also be used for reading the data and offloading some of the workload from the master.

Both solutions have their own limits and features, both suffer from different problems. Both can be affected by unstable network connections. Let’s take a look at those limitations and how we can design the environment to minimize the impact of an unstable network infrastructure.

Galera Cluster - Network Problems

First, let’s take a look at Galera Cluster. As we discussed, it works best in a low-latency environment. One of the main latency-related problems in Galera is the way how Galera handles the writes. We will not go into all the details in this blog, but further reading in our Galera Cluster for MySQL tutorial. The bottom line is that, due to the certification process for writes, where all nodes in the cluster have to agree on whether the write can be applied or not, your write performance for single row is strictly limited by the network roundtrip time between the writer node and the most far away node. As long as the latency is acceptable and as long as you do not have too many hot spots in your data, WAN setups may work just fine. The problem starts when the network latency spikes from time to time. Writes will then take 3 or 4 times longer than usual and, as a result, databases may start to be overloaded with long-running writes.

One of great features of Galera Cluster is its ability to detect the cluster state and react upon network partitioning. If a node of the cluster cannot be reached, it will be evicted from the cluster and it will not be able to perform any writes. This is crucial in maintaining the integrity of the data during the time when the cluster is split - only the majority of the cluster will accept writes. Minority will complain. To handle this, Galera introduces a vast array of checks and configurable timeouts to avoid false alerts on very transient network issues. Unfortunately, if the network is unreliable, Galera Cluster will not be able to work correctly - nodes will start to leave the cluster, join it later. It will be especially problematic when we have Galera Cluster spanning across WAN - separated pieces of the cluster may disappear randomly if the interconnecting network will not work properly.

How to Design Galera Cluster for an Unstable Network?

First things first, if you have network problems within the single datacenter, there is not much you can do unless you will be able to solve those issues somehow. Unreliable local network is a no go for Galera Cluster, you have to reconsider using some other solution (even though, to be honest, unreliable network will always be a problematic). On the other hand, if the problems are related to WAN connections only (and this is one of the most typical cases), it may be possible to replace WAN Galera links with regular asynchronous replication (if the Galera WAN tuning did not help).

There are several inherent limitations in this setup - the main issue is that the writes used to happen locally. Now, all the writes will have to head to the “master” datacenter (DC A in our case). This is not as bad as it sounds. Please keep in mind that in an all-Galera environment, writes will be slowed down by the latency between nodes located in different datacenters. Even local writes will be affected. It will be more or less the same slowdown as with asynchronous setup in which you would send the writes across WAN to the “master” datacenter.

Using asynchronous replication comes with all of the problems typical for the asynchronous replication. Replication lag may become a problem - not that Galera would be more performant, it’s just that Galera would slow down the traffic via flow control while replication does not have any mechanism to throttle the traffic on the master.

Another problem is the failover: if the “master” Galera node (the one which acts as the master to the slaves in other datacenters) would fail, some mechanism has to be created to repoint slaves to another, working master node. It might be some sort of a script, it is also possible to try something with VIP where the “slave” Galera cluster slaves off Virtual IP which is always assigned to the alive Galera node in the “master” cluster.

The main advantage of such setup is that we do remove the WAN Galera link which means that our “master” cluster will not be slowed down by the fact that some of the nodes are separated geographically. As we mentioned, we lose the ability to write in all of the data-centers but latency-wise writing across the WAN is the same as writing locally to the Galera cluster which spans across WAN. As a result the overall latency should improve. Asynchronous replication is also less vulnerable to the unstable networks. Worst case scenario, the replication link will break and it will be recreated when the networks converge.

ClusterControl
Single Console for Your Entire Database Infrastructure
Find out what else is new in ClusterControl

How to Design MySQL Replication for an Unstable Network?

In the previous section, we covered Galera cluster and one solution was to use asynchronous replication. How does it look like in a plain asynchronous replication setup? Let’s look at how an unstable network can cause the biggest disruptions in the replication setup.

First of all, latency - one of the main pain points for Galera Cluster. In case of replication, it is almost a non-issue. Unless you use semi-synchronous replication that is - in such case, increased latency will slow down writes. In asynchronous replication, latency has no impact on the write performance. It may, though, have some impact on the replication lag. It is not anything as significant as it was for Galera but you may expect more lag spikes and overall less stable replication performance if the network between nodes suffers from high latency. This is mostly due to the fact that the master may as well serve several writes before data transfer to the slave can be initiated on high latency network.

The network instability may definitely impact replication links but it is, again, not that critical. MySQL slaves will attempt to reconnect to their masters and replication will commence.

The main issue with MySQL replication is actually something that Galera Cluster solves internally - network partitioning. We are talking about the network partitioning as the condition in which segments of the network are separated from each other. MySQL replication utilizes one single writer node - master. No matter how you design your environment, you have to send your writes to the master. If the master is not available (for whatever reasons), application cannot do its job unless it runs in some sort of read-only mode. Therefore there is a need to pick the new master as soon as possible. This is where the issues show up.

First, how to tell which host is a master and which one is not. One of the usual ways is to use the “read_only” variable to distinguish slaves from the master. If node has read_only enabled (set read_only=1), it is a slave (as slaves should not handle any direct writes). If the node has read_only disabled (set read_only=0), it is a master. To make things safer, a common approach is to set read_only=1 in MySQL configuration - in case of a restart, it is safer if the node shows up as a slave. Such “language” can be understood by proxies like ProxySQL or MaxScale.

Let’s take a look at an example.

We have application hosts which connect to the proxy layer. Proxies perform the read/write split sending SELECTs to slaves and writes to master. If master is down, failover is performed, new master is promoted, proxy layer detects that and start sending writes to another node.

If node1 restarts, it will come up with read_only=1 and it will be detected as a slave. It is not ideal as it is not replicating but it is acceptable. Ideally, the old master should not show up at all until it is rebuilt and slaved off the new master.

Way more problematic situation is if we have to deal with network partitioning. Let’s consider the same setup: application tier, proxy tier and databases.

When the network makes the master not reachable, the application is not usable as no writes make it to their destination. New master is promoted, writes are redirected to it. What will happen then if the network issues cease and the old master becomes reachable? It has not been stopped, therefore it is still using read_only=0:

You’ve now ended up in a split brain, when writes were directed to two nodes. This situation is pretty bad as to merge diverged datasets may take a while and it is quite a complex process.

What can be done to avoid this problem? There is no silver bullet but some actions can be taken to minimize the probability of a split brain to happen.

First of all, you can be smarter in detecting the state of the master. How do the slaves see it? Can they replicate from it? Maybe some of the slaves still can connect to the master, meaning that the master is up and running or, at least, making it possible to stop it should that be necessary. What about the proxy layer? Do all of the proxy nodes see the master as unavailable? If some can still connect, than you can try to utilize those nodes to ssh into the master and stop it before the failover?

The failover management software can also be smarter in detecting the state of the network. Maybe it utilizes RAFT or some other clustering protocol to build a quorum-aware cluster. If a failover management software can detect the split brain, it can also take some actions based on this like, for example, setting all nodes in the partitioned segment to read_only ensuring that the old master will not show up as writable when the networks converge.

You can also include tools like Consul or Etcd to store the state of the cluster. The proxy layer can be configured to use data from Consul, not the state of the read_only variable. It will be then up to the failover management software to make necessary changes in Consul so that all proxies will send the traffic to a correct, new master.

Some of those hints can even be combined together to make the failure detection even more reliable. All in all, it is possible to minimize the chances that the replication cluster will suffer from unreliable networks.

As you can see, no matter if we are talking about Galera or MySQL Replication, unstable networks may become a serious problem. On the other hand, if you design the environment correctly, you can still make it work. We hope this blog post will help you to create environments which will work stable even if the networks are not.

High Availability on a Shoestring Budget - Deploying a Minimal Two Node MySQL Galera Cluster

$
0
0

We regularly get questions about how to set up a Galera cluster with just 2 nodes.

The documentation clearly states you should have at least 3 Galera nodes to avoid network partitioning. But there are some valid reasons for considering a 2 node deployment, e.g., if you want to achieve database high availability but have a limited budget to spend on a third database node. Or perhaps you are running Galera in a development/sandbox environment and prefer a minimal setup.

Galera implements a quorum-based algorithm to select a primary component through which it enforces consistency. The primary component needs to have a majority of votes, so in a 2 node system, there would be no majority resulting in split brain. Fortunately, it is possible to add a garbd (Galera Arbitrator Daemon), which is a lightweight stateless daemon that can act as the odd node. Arbitrator failure does not affect the cluster operations and a new instance can be reattached to the cluster at any time. There can be several arbitrators in the cluster.

ClusterControl has support for deploying garbd on non-database hosts.

Normally a Galera cluster needs at least three hosts to be fully functional, however, at deploy time, two nodes would suffice to create a primary component. Here are the steps:

  1. Deploy a Galera cluster of two nodes,
  2. After the cluster has been deployed by ClusterControl, add garbd on the ClusterControl node.

You should end up with the below setup:

Deploy the Galera Cluster

Go to the ClusterControl Deploy section to deploy the cluster.

After selecting the technology that we want to deploy, we must specify User, Key or Password and port to connect by SSH to our hosts. We also need the name for our new cluster and if we want ClusterControl to install the corresponding software and configurations for us.

After setting up the SSH access information, we must select vendor/version and we must define the database admin password, datadir and port. We can also specify which repository to use.

Even though ClusterControl warns you that a Galera cluster needs an odd number of nodes, only add two nodes to the cluster.

Deploying a Galera cluster will trigger a ClusterControl job which can be monitored at the Jobs page.

ClusterControl
Single Console for Your Entire Database Infrastructure
Find out what else is new in ClusterControl

Install Garbd

Once deployment is complete, install garbd on the ClusterControl host. We have the option to deploy garbd from ClusterControl, but this option won’t work if we want to deploy it in the same ClusterControl server. This is to avoid some issue related to the database versions and package dependencies.

So, we must install it manually, and then import garbd to ClusterControl.

Let’s see the manual installation of Percona Garbd on CentOS 7.

Create the Percona repository file:

$ vi /etc/yum.repos.d/percona.repo
[percona-release-$basearch]
name = Percona-Release YUM repository - $basearch
baseurl = http://repo.percona.com/release/$releasever/RPMS/$basearch
enabled = 1
gpgcheck = 0
[percona-release-noarch]
name = Percona-Release YUM repository - noarch
baseurl = http://repo.percona.com/release/$releasever/RPMS/noarch
enabled = 1
gpgcheck = 0
[percona-release-source]
name = Percona-Release YUM repository - Source packages
baseurl = http://repo.percona.com/release/$releasever/SRPMS
enabled = 0
gpgcheck = 0

Then, install the Percona XtraDB Cluster garbd package:

$ yum install Percona-XtraDB-Cluster-garbd-57

Now, we need to configure garbd. For this, we need to edit the /etc/sysconfig/garb file:

$ vi /etc/sysconfig/garb
# Copyright (C) 2012 Codership Oy
# This config file is to be sourced by garb service script.
# A comma-separated list of node addresses (address[:port]) in the cluster
GALERA_NODES="192.168.100.192:4567,192.168.100.193:4567"
# Galera cluster name, should be the same as on the rest of the nodes.
GALERA_GROUP="Galera1"
# Optional Galera internal options string (e.g. SSL settings)
# see http://galeracluster.com/documentation-webpages/galeraparameters.html
# GALERA_OPTIONS=""
# Log file for garbd. Optional, by default logs to syslog
# Deprecated for CentOS7, use journalctl to query the log for garbd
# LOG_FILE=""

Change the GALERA_NODES and GALERA_GROUP parameter according to the Galera nodes configuration. We also need to remove the line # REMOVE THIS AFTER CONFIGURATION before starting the service.

And now, we can start the garb service:

$ service garb start
Redirecting to /bin/systemctl start garb.service

Now, we can import the new garbd into ClusterControl.

Go to ClusterControl -> Select Cluster -> Add Load Balancer.

Then, select Garbd and Import Garbd section.

Here we only need to specify the hostname or IP Address and the port of the new Garbd.

Importing garbd will trigger a ClusterControl job which can be monitored at the Jobs page. Once completed, you can verify garbd is running with a green tick icon at the top bar:

That’s it!

Our minimal two-node Galera cluster is now ready!

How to Manage MySQL - for Oracle DBAs

$
0
0

Open source databases are quickly becoming mainstream, so migration from proprietary engines into open source engines is a kind of an industry trend now. It also means that we DBA’s often end up having multiple database backends to manage.

In the past few blog posts, my colleague Paul Namuag and I covered several aspects of migration from Oracle to Percona, MariaDB, and MySQL. The obvious goal for the migration is to get your application up and running more efficiently in the new database environment, however it’s crucial to assure that staff is ready to support it.

This blog covers the basic operations of MySQL with reference to similar tasks that you would perform daily in your Oracle environment. It provides you with a deep dive on different topics to save you time as you can relate to Oracle knowledge that you’ve already built over the years.

We will also talk about external command line tools that are missing in the default MySQL installation but are needed to perform daily operations efficiently. The open source version doesn’t come with the equivalent of Oracle Cloud Control for instance, so do checkout ClusterControl if you are looking for something similar.

In this blog, we are assuming you have a better knowledge of Oracle than MySQL and hence would like to know the correlation between the two. The examples are based on Linux platform however you can find many similarities in managing MySQL on Windows.

How do I connect to MySQL?

Let’s start our journey with a very (seemingly) basic task. Actually, this is a kind of task which can cause some confusion due to different login concepts in Oracle and MySQL.

The equivalent of sqlplus / as sysdba connection is “mysql” terminal command with a flag -uroot. In the MySQL world, the superuser is called root. MySQL database users (including root) are defined by the name and host from where it can connect.

The information about user and hosts from where it can connect is stored in mysql.user table. With the connection attempt, MySQL checks if the client host, username and password match the row in the metadata table.

This is a bit of a different approach than in Oracle where we have a user name and password only, but those who are familiar with Oracle Connection Manager might find some similarities.

You will not find predefined TNS entries like in Oracle. Usually, for an admin connection, we need user, password and -h host flag. The default port is 3306 (like 1521 in Oracle) but this may vary on different setups.

By default, many installations will have root access connection from any machine (root@’%’) blocked, so you have to log in to the server hosting MySQL, typically via ssh.

Type the following:

mysql -u root

When the root password is not set this is enough. If the password is required then you should add the flag -p.

mysql -u root -p

You are now logged in to the mysql client (the equivalent of sqlplus) and will see a prompt, typically 'mysql>'.

Is MySQL up and running?

You can use the mysql service startup script or mysqladmin command to find out if it is running. Then you can use the ps command to see if mysql processes are up and running. Another alternative can be mysqladmin, which is a utility that is used for performing administrative operations.

mysqladmin -u root -p status

On Debian:

/etc/init.d/mysql status

If you are using RedHat or Fedora then you can use the following script:

service mysqld status

Or

/etc/init.d/mysqld status

Or

systemctl status mysql.service

On MariaDB instances, you should look for the MariaDB service name.

systemctl status mariadb

What’s in this database?

Like in Oracle, you can querythe metadata objects to get information about database objects.

It’s common to use some shortcuts here, commands that help you to list objects or get DDL of the objects.

show databases;
use database_name;
show tables;
show table status;
show index from table_name;
show create table table_name;

Similar to Oracle you can describe the table:

desc table_name;

Where is my data stored?

There is no dedicated internal storage like ASM in MySQL. All data files are placed in the regular OS mount points. With a default installation, you can find your data in:

/var/lib/mysql

The location is based on the variable datadir.

root@mysql-3:~# cat /etc/mysql/my.cnf | grep datadir
datadir=/var/lib/mysql

You will see there a directory for each database.

Depending on the version and storage engine (yes there are a few here), the database’s directory may contain files of the format *.frm, which define the structure of each table within the database. For MyISAM tables, the data (*.MYD) and indexes (*.MYI) are stored within this directory also.

InnoDB tables are stored in InnoDB tablespaces. Each of which consists of one or more files, which are similar to Oracle tablespaces. In a default installation, all InnoDB data and indexes for all databases on a MySQL server are held in one tablespace, consisting of one file: /var/lib/mysql/ibdata1. In most setups, you don’t manage tablespaces like in Oracle. The best practice is to keep them with autoextend on and max size unlimited.

root@mysql-3:~# cat /etc/mysql/my.cnf | grep innodb-data-file-path
innodb-data-file-path = ibdata1:100M:autoextend

InnoDB has log files, which are the equivalent of Oracle redo logs, allowing automatic crash recovery. By default there are two log files: /var/lib/mysql/ib_logfile0 and /var/lib/mysql/ib_logfile1. Undo data is held within the tablespace file.

root@galera-3:/var/lib/mysql# ls -rtla | grep logfile
-rw-rw----  1 mysql mysql  268435456 Dec 15 00:59 ib_logfile1
-rw-rw----  1 mysql mysql  268435456 Mar  6 11:45 ib_logfile0

Where is the metadata information?

There are no dba_*, user_*, all_* type of views but MySQL has internal metadata views.

Information_schema is defined in the SQL 2003 standard and is implemented by other major databases, e.g. SQL Server, PostgreSQL.

Since MySQL 5.0, the information_schema database has been available, containing data dictionary information. The information was actually stored in the external FRM files. Finally, after many years .frm files are gone in version 8.0. The metadata is still visible in the information_schema database but uses the InnoDB storage engine.

To see all actual views contained in the data dictionary within the mysql client, switch to information_schema database:

use information_schema;
show tables;

You can find additional information in the MySQL database,which contains information about db, event (MySQL jobs), plugins, replication, database, users etc.

The number of views depends on the version and vendor.

ClusterControl
Single Console for Your Entire Database Infrastructure
Find out what else is new in ClusterControl

Select * from v$session

Oracle’s select * from v$session is represented here with the command SHOW PROCESSLIST which shows the list of threads.

mysql> SHOW PROCESSLIST;
+---------+------------------+------------------+--------------------+---------+--------+--------------------+------------------+-----------+---------------+
| Id      | User             | Host             | db                 | Command | Time   | State              | Info             | Rows_sent | Rows_examined |
+---------+------------------+------------------+--------------------+---------+--------+--------------------+------------------+-----------+---------------+
|       1 | system user      |                  | NULL               | Sleep   | 469264 | wsrep aborter idle | NULL             |         0 |             0 |
|       2 | system user      |                  | NULL               | Sleep   | 469264 | NULL               | NULL             |         0 |             0 |
|       3 | system user      |                  | NULL               | Sleep   | 469257 | NULL               | NULL             |         0 |             0 |
|       4 | system user      |                  | NULL               | Sleep   | 469257 | NULL               | NULL             |         0 |             0 |
|       6 | system user      |                  | NULL               | Sleep   | 469257 | NULL               | NULL             |         0 |             0 |
|      16 | maxscale         | 10.0.3.168:5914  | NULL               | Sleep   |      5 |                    | NULL             |         4 |             4 |
|      59 | proxysql-monitor | 10.0.3.168:6650  | NULL               | Sleep   |      7 |                    | NULL             |         0 |             0 |
|      81 | proxysql-monitor | 10.0.3.78:62896  | NULL               | Sleep   |      6 |                    | NULL             |         0 |             0 |
|    1564 | proxysql-monitor | 10.0.3.78:25064  | NULL               | Sleep   |      3 |                    | NULL             |         0 |             0 |
| 1822418 | cmon             | 10.0.3.168:41202 | information_schema | Sleep   |      0 |                    | NULL             |         0 |             8 |
| 1822631 | cmon             | 10.0.3.168:43254 | information_schema | Sleep   |      4 |                    | NULL             |         1 |             1 |
| 1822646 | cmon             | 10.0.3.168:43408 | information_schema | Sleep   |      0 |                    | NULL             |       464 |           464 |
| 2773260 | backupuser       | localhost        | mysql              | Query   |      0 | init               | SHOW PROCESSLIST |         0 |             0 |
+---------+------------------+------------------+--------------------+---------+--------+--------------------+------------------+-----------+---------------+


13 rows in set (0.00 sec)

It is based on information stored in the information_schema.processlist view. The view requires to have the PROCESS privilege. It can also help you to check if you are running out of the maximum number of processes.

Where is an alert log?

The error log can be found in my.cnf or via show variables command.

mysql> show variables like 'log_error';
+---------------+--------------------------+
| Variable_name | Value                    |
+---------------+--------------------------+
| log_error     | /var/lib/mysql/error.log |
+---------------+--------------------------+
1 row in set (0.00 sec)

Where is the list of the users and their permissions?

The information about users is stored in the mysql.user table, while the grants are stored in several places including the mysql.user, mysql.tables_priv,

MySQL user access is defined in:

mysql.columns_priv, mysql.tables_priv, mysql.db,mysql.user

The preferable way to list grants is to use pt-grants, the tool from Percona toolkit (a must-have for every MySQL DBA).

pt-show-grants --host localhost --user root --ask-pass

Alternatively, you can use the following query (created by Calvaldo)

SELECT
    CONCAT("`",gcl.Db,"`") AS 'Database(s) Affected',
    CONCAT("`",gcl.Table_name,"`") AS 'Table(s) Affected',
    gcl.User AS 'User-Account(s) Affected',
    IF(gcl.Host='%','ALL',gcl.Host) AS 'Remote-IP(s) Affected',
    CONCAT("GRANT ",UPPER(gcl.Column_priv)," (",GROUP_CONCAT(gcl.Column_name),") ",
                 "ON `",gcl.Db,"`.`",gcl.Table_name,"` ",
                 "TO '",gcl.User,"'@'",gcl.Host,"';") AS 'GRANT Statement (Reconstructed)'
FROM mysql.columns_priv gcl
GROUP BY CONCAT(gcl.Db,gcl.Table_name,gcl.User,gcl.Host)
/* SELECT * FROM mysql.columns_priv */

UNION

/* [Database.Table]-Specific Grants */
SELECT
    CONCAT("`",gtb.Db,"`") AS 'Database(s) Affected',
    CONCAT("`",gtb.Table_name,"`") AS 'Table(s) Affected',
    gtb.User AS 'User-Account(s) Affected',
    IF(gtb.Host='%','ALL',gtb.Host) AS 'Remote-IP(s) Affected',
    CONCAT(
        "GRANT ",UPPER(gtb.Table_priv),"",
        "ON `",gtb.Db,"`.`",gtb.Table_name,"` ",
        "TO '",gtb.User,"'@'",gtb.Host,"';"
    ) AS 'GRANT Statement (Reconstructed)'
FROM mysql.tables_priv gtb
WHERE gtb.Table_priv!=''
/* SELECT * FROM mysql.tables_priv */

UNION

/* Database-Specific Grants */
SELECT
    CONCAT("`",gdb.Db,"`") AS 'Database(s) Affected',
    "ALL" AS 'Table(s) Affected',
    gdb.User AS 'User-Account(s) Affected',
    IF(gdb.Host='%','ALL',gdb.Host) AS 'Remote-IP(s) Affected',
    CONCAT(
        'GRANT ',
        CONCAT_WS(',',
            IF(gdb.Select_priv='Y','SELECT',NULL),
            IF(gdb.Insert_priv='Y','INSERT',NULL),
            IF(gdb.Update_priv='Y','UPDATE',NULL),
            IF(gdb.Delete_priv='Y','DELETE',NULL),
            IF(gdb.Create_priv='Y','CREATE',NULL),
            IF(gdb.Drop_priv='Y','DROP',NULL),
            IF(gdb.Grant_priv='Y','GRANT',NULL),
            IF(gdb.References_priv='Y','REFERENCES',NULL),
            IF(gdb.Index_priv='Y','INDEX',NULL),
            IF(gdb.Alter_priv='Y','ALTER',NULL),
            IF(gdb.Create_tmp_table_priv='Y','CREATE TEMPORARY TABLES',NULL),
            IF(gdb.Lock_tables_priv='Y','LOCK TABLES',NULL),
            IF(gdb.Create_view_priv='Y','CREATE VIEW',NULL),
            IF(gdb.Show_view_priv='Y','SHOW VIEW',NULL),
            IF(gdb.Create_routine_priv='Y','CREATE ROUTINE',NULL),
            IF(gdb.Alter_routine_priv='Y','ALTER ROUTINE',NULL),
            IF(gdb.Execute_priv='Y','EXECUTE',NULL),
            IF(gdb.Event_priv='Y','EVENT',NULL),
            IF(gdb.Trigger_priv='Y','TRIGGER',NULL)
        ),
        " ON `",gdb.Db,"`.* TO '",gdb.User,"'@'",gdb.Host,"';"
    ) AS 'GRANT Statement (Reconstructed)'
FROM mysql.db gdb
WHERE gdb.Db != ''
/* SELECT * FROM mysql.db */

UNION

/* User-Specific Grants */
SELECT
    "ALL" AS 'Database(s) Affected',
    "ALL" AS 'Table(s) Affected',
    gus.User AS 'User-Account(s) Affected',
    IF(gus.Host='%','ALL',gus.Host) AS 'Remote-IP(s) Affected',
    CONCAT(
        "GRANT ",
        IF((gus.Select_priv='N')&(gus.Insert_priv='N')&(gus.Update_priv='N')&(gus.Delete_priv='N')&(gus.Create_priv='N')&(gus.Drop_priv='N')&(gus.Reload_priv='N')&(gus.Shutdown_priv='N')&(gus.Process_priv='N')&(gus.File_priv='N')&(gus.References_priv='N')&(gus.Index_priv='N')&(gus.Alter_priv='N')&(gus.Show_db_priv='N')&(gus.Super_priv='N')&(gus.Create_tmp_table_priv='N')&(gus.Lock_tables_priv='N')&(gus.Execute_priv='N')&(gus.Repl_slave_priv='N')&(gus.Repl_client_priv='N')&(gus.Create_view_priv='N')&(gus.Show_view_priv='N')&(gus.Create_routine_priv='N')&(gus.Alter_routine_priv='N')&(gus.Create_user_priv='N')&(gus.Event_priv='N')&(gus.Trigger_priv='N')&(gus.Create_tablespace_priv='N')&(gus.Grant_priv='N'),
            "USAGE",
            IF((gus.Select_priv='Y')&(gus.Insert_priv='Y')&(gus.Update_priv='Y')&(gus.Delete_priv='Y')&(gus.Create_priv='Y')&(gus.Drop_priv='Y')&(gus.Reload_priv='Y')&(gus.Shutdown_priv='Y')&(gus.Process_priv='Y')&(gus.File_priv='Y')&(gus.References_priv='Y')&(gus.Index_priv='Y')&(gus.Alter_priv='Y')&(gus.Show_db_priv='Y')&(gus.Super_priv='Y')&(gus.Create_tmp_table_priv='Y')&(gus.Lock_tables_priv='Y')&(gus.Execute_priv='Y')&(gus.Repl_slave_priv='Y')&(gus.Repl_client_priv='Y')&(gus.Create_view_priv='Y')&(gus.Show_view_priv='Y')&(gus.Create_routine_priv='Y')&(gus.Alter_routine_priv='Y')&(gus.Create_user_priv='Y')&(gus.Event_priv='Y')&(gus.Trigger_priv='Y')&(gus.Create_tablespace_priv='Y')&(gus.Grant_priv='Y'),
                "ALL PRIVILEGES",
                CONCAT_WS(',',
                    IF(gus.Select_priv='Y','SELECT',NULL),
                    IF(gus.Insert_priv='Y','INSERT',NULL),
                    IF(gus.Update_priv='Y','UPDATE',NULL),
                    IF(gus.Delete_priv='Y','DELETE',NULL),
                    IF(gus.Create_priv='Y','CREATE',NULL),
                    IF(gus.Drop_priv='Y','DROP',NULL),
                    IF(gus.Reload_priv='Y','RELOAD',NULL),
                    IF(gus.Shutdown_priv='Y','SHUTDOWN',NULL),
                    IF(gus.Process_priv='Y','PROCESS',NULL),
                    IF(gus.File_priv='Y','FILE',NULL),
                    IF(gus.References_priv='Y','REFERENCES',NULL),
                    IF(gus.Index_priv='Y','INDEX',NULL),
                    IF(gus.Alter_priv='Y','ALTER',NULL),
                    IF(gus.Show_db_priv='Y','SHOW DATABASES',NULL),
                    IF(gus.Super_priv='Y','SUPER',NULL),
                    IF(gus.Create_tmp_table_priv='Y','CREATE TEMPORARY TABLES',NULL),
                    IF(gus.Lock_tables_priv='Y','LOCK TABLES',NULL),
                    IF(gus.Execute_priv='Y','EXECUTE',NULL),
                    IF(gus.Repl_slave_priv='Y','REPLICATION SLAVE',NULL),
                    IF(gus.Repl_client_priv='Y','REPLICATION CLIENT',NULL),
                    IF(gus.Create_view_priv='Y','CREATE VIEW',NULL),
                    IF(gus.Show_view_priv='Y','SHOW VIEW',NULL),
                    IF(gus.Create_routine_priv='Y','CREATE ROUTINE',NULL),
                    IF(gus.Alter_routine_priv='Y','ALTER ROUTINE',NULL),
                    IF(gus.Create_user_priv='Y','CREATE USER',NULL),
                    IF(gus.Event_priv='Y','EVENT',NULL),
                    IF(gus.Trigger_priv='Y','TRIGGER',NULL),
                    IF(gus.Create_tablespace_priv='Y','CREATE TABLESPACE',NULL)
                )
            )
        ),
        " ON *.* TO '",gus.User,"'@'",gus.Host,"' REQUIRE ",
        CASE gus.ssl_type
            WHEN 'ANY' THEN
                "SSL "
            WHEN 'X509' THEN
                "X509 "
            WHEN 'SPECIFIED' THEN
                CONCAT_WS("AND ",
                    IF((LENGTH(gus.ssl_cipher)>0),CONCAT("CIPHER '",CONVERT(gus.ssl_cipher USING utf8),"'"),NULL),
                    IF((LENGTH(gus.x509_issuer)>0),CONCAT("ISSUER '",CONVERT(gus.ssl_cipher USING utf8),"'"),NULL),
                    IF((LENGTH(gus.x509_subject)>0),CONCAT("SUBJECT '",CONVERT(gus.ssl_cipher USING utf8),"'"),NULL)
                )
            ELSE "NONE "
        END,
        "WITH ",
        IF(gus.Grant_priv='Y',"GRANT OPTION ",""),
        "MAX_QUERIES_PER_HOUR ",gus.max_questions,"",
        "MAX_CONNECTIONS_PER_HOUR ",gus.max_connections,"",
        "MAX_UPDATES_PER_HOUR ",gus.max_updates,"",
        "MAX_USER_CONNECTIONS ",gus.max_user_connections,
        ";"
    ) AS 'GRANT Statement (Reconstructed)'
FROM mysql.user gus;

How to create a mysql user

The ‘create user’ procedure is similar to Oracle. The simplest example could be:

CREATE user 'username'@'hostname' identified by 'password';
GRANT privilege_name on *.* TO 'username'@'hostname';

The option to grant and create in one line with:

GRANT privilege_name  ON *.* TO 'username'@'hostname' identified by 'password';

has been removed in MySQL 8.0.

How do I start and stop MySQL?

You can stop and start MySQL with the service.

The actual command depends on the Linux distribution and the service name.

Below you can find an example with the service name mysqld.

Ubuntu

/etc/init.d/mysqld start 
/etc/init.d/mysqld stop 
/etc/init.d/mysqld restart

RedHat/Centos

service mysqld start 
service mysqld stop 
service mysqld restart
systemctl start mysqld.service
systemctl stop mysqld.service
systemctl restart mysqld.service

Where is the MySQL Server Configuration data?

The configuration is stored in the my.cnf file.

Until version 8.0, any dynamic setting change that should remain after a restart required a manual update of the my.cnf file. Similar to Oracle’s scope=both, you can change values using the persistent option.

mysql> SET PERSIST max_connections = 1000;
mysql> SET @@PERSIST.max_connections = 1000;

For older versions use:

mysql> SET GLOBAL max_connections = 1000;
$ vi /etc/mysql/my.cnf
SET GLOBAL max_connections = 1000;

How do I backup MySQL?

There are two ways to execute a mysql backup.

For smaller databases or smaller selective backups, you can use the mysqldump command.

Database backup with mysqldump (logical backup):

mysqldump -uuser -p --databases db_name --routines --events --single-transaction | gzip > db_name_backup.sql.gz

xtrabackup, mariabackup (hot binary backup)

The preferable method is to use xtrabackup or mariabackup, external tools to run hot binary backups.

Oracle offers hot binary backup in the paid version called MySQL Enterprise Edition.

mariabackup --user=root --password=PASSWORD --backup --target-dir=/u01/backups/

Stream backup to other server

Start a listener on the external server on the preferable port (in this example 1984)

nc -l 1984 | pigz -cd - | pv | xbstream -x -C /u01/backups

Run backup and transfer to external host

innobackupex --user=root --password=PASSWORD --stream=xbstream /var/tmp | pigz  | pv | nc external_host.com 1984

Copy user permission

It’s often needed to copy user permission and transfer them to the other servers.

The recommended way to do this is to use pt-show-grants.

pt-show-grants > /u01/backups

How do I restore MySQL?

Logical backup restore

MySQLdump creates the SQL file, which can be executed with the source command.

To keep the log file of the execution, use the tee command.

mysql> tee dump.log
mysql> source mysqldump.sql

Binary backup restore (xtrabackup/mariabackup)

To restore of MySQL from the binary backup you need to first restore the files and then apply the log files.

You can compare this process to restore and recover in Oracle.

xtrabackup --copy-back --target-dir=/var/lib/data
innobackupex --apply-log --use-memory=[values in MB or GB] /var/lib/data

Hopefully, these tips give a good overview of how to perform basic administrative tasks.


HA for MySQL and MariaDB - Comparing Master-Master Replication to Galera Cluster

$
0
0

Galera replication is relatively new if compared to MySQL replication, which is natively supported since MySQL v3.23. Although MySQL replication is designed for master-slave unidirectional replication, it can be configured as an active master-master setup with bidirectional replication. While it is easy to set up, and some use cases might benefit from this “hack”, there are a number of caveats. On the other hand, Galera cluster is a different type of technology to learn and manage. Is it worth it?

In this blog post, we are going to compare master-master replication to Galera cluster.

Replication Concepts

Before we jump into the comparison, let’s explain the basic concepts behind these two replication mechanisms.

Generally, any modification to the MySQL database generates an event in binary format. This event is transported to the other nodes depending on the replication method chosen - MySQL replication (native) or Galera replication (patched with wsrep API).

MySQL Replication

The following diagrams illustrates the data flow of a successful transaction from one node to another when using MySQL replication:

The binary event is written into the master's binary log. The slave(s) via slave_IO_thread will pull the binary events from master's binary log and replicate them into its relay log. The slave_SQL_thread will then apply the event from the relay log asynchronously. Due to the asynchronous nature of replication, the slave server is not guaranteed to have the data when the master performs the change.

Ideally, MySQL replication will have the slave to be configured as a read-only server by setting read_only=ON or super_read_only=ON. This is a precaution to protect the slave from accidental writes which can lead to data inconsistency or failure during master failover (e.g., errant transactions). However, in a master-master active-active replication setup, read-only has to be disabled on the other master to allow writes to be processed simultaneously. The primary master must be configured to replicate from the secondary master by using the CHANGE MASTER statement to enable circular replication.

Galera Replication

The following diagrams illustrates the data replication flow of a successful transaction from one node to another for Galera Cluster:

The event is encapsulated in a writeset and broadcasted from the originator node to the other nodes in the cluster by using Galera replication. The writeset undergoes certification on every Galera node and if it passes, the applier threads will apply the writeset asynchronously. This means that the slave server will eventually become consistent, after agreement of all participating nodes in global total ordering. It is logically synchronous, but the actual writing and committing to the tablespace happens independently, and thus asynchronously on each node with a guarantee for the change to propagate on all nodes.

Avoiding Primary Key Collision

In order to deploy MySQL replication in master-master setup, one has to adjust the auto increment value to avoid primary key collision for INSERT between two or more replicating masters. This allows the primary key value on masters to interleave each other and prevent the same auto increment number being used twice on either of the node. This behaviour must be configured manually, depending on the number of masters in the replication setup. The value of auto_increment_increment equals to the number of replicating masters and the auto_increment_offset must be unique between them. For example, the following lines should exist inside the corresponding my.cnf:

Master1:

log-slave-updates
auto_increment_increment=2
auto_increment_offset=1

Master2:

log-slave-updates
auto_increment_increment=2
auto_increment_offset=2

Likewise, Galera Cluster uses this same trick to avoid primary key collisions by controlling the auto increment value and offset automatically with wsrep_auto_increment_control variable. If set to 1 (the default), will automatically adjust the auto_increment_increment and auto_increment_offset variables according to the size of the cluster, and when the cluster size changes. This avoids replication conflicts due to auto_increment. In a master-slave environment, this variable can be set to OFF.

The consequence of this configuration is the auto increment value will not be in sequential order, as shown in the following table of a three-node Galera Cluster:

Nodeauto_increment_incrementauto_increment_offsetAuto increment value
Node 1311, 4, 7, 10, 13, 16...
Node 2322, 5, 8, 11, 14, 17...
Node 3333, 6, 9, 12, 15, 18...

If an application performs insert operations on the following nodes in the following order:

  • Node1, Node3, Node2, Node3, Node3, Node1, Node3 ..

Then the primary key value that will be stored in the table will be:

  • 1, 6, 8, 9, 12, 13, 15 ..

Simply said, when using master-master replication (MySQL replication or Galera), your application must be able to tolerate non-sequential auto-increment values in its dataset.

For ClusterControl users, take note that it supports deployment of MySQL master-master replication with a limit of two masters per replication cluster, only for active-passive setup. Therefore, ClusterControl does not deliberately configure the masters with auto_increment_increment and auto_increment_offset variables.

Data Consistency

Galera Cluster comes with its flow-control mechanism, where each node in the cluster must keep up when replicating, or otherwise all other nodes will have to slow down to allow the slowest node to catch up. This basically minimizes the probability of slave lag, although it might still happen but not as significant as in MySQL replication. By default, Galera allows nodes to be at least 16 transactions behind in applying through variable gcs.fc_limit. If you want to do critical reads (a SELECT that must return most up to date information), you probably want to use session variable, wsrep_sync_wait.

Galera Cluster on the other hand comes with a safeguard to data inconsistency whereby a node will get evicted from the cluster if it fails to apply any writeset for whatever reasons. For example, when a Galera node fails to apply writeset due to internal error by the underlying storage engine (MySQL/MariaDB), the node will pull itself out from the cluster with the following error:

150305 16:13:14 [ERROR] WSREP: Failed to apply trx 1 4 times
150305 16:13:14 [ERROR] WSREP: Node consistency compromized, aborting..

To fix the data consistency, the offending node has to be re-synced before it is allowed to join the cluster. This can be done manually or by wiping out the data directory to trigger snapshot state transfer (full syncing from a donor).

MySQL master-master replication does not enforce data consistency protection and a slave is allowed to diverge e.g, replicate a subset of data or lag behind, which makes the slave inconsistent with the master. It is designed to replicate data in one flow - from master down to the slaves. Data consistency checks have to be performed manually or via external tools like Percona Toolkit pt-table-checksum or mysql-replication-check.

Conflict Resolution

Generally, master-master (or multi-master, or bi-directional) replication allows more than one member in the cluster to process writes. With MySQL replication, in case of replication conflict, the slave's SQL thread simply stops applying the next query until the conflict is resolved, either by manually skipping the replication event, fixing the offending rows or resyncing the slave. Simply said, there is no automatic conflict resolution support for MySQL replication.

Galera Cluster provides a better alternative by retrying the offending transaction during replication. By using wsrep_retry_autocommit variable, one can instruct Galera to automatically retry a failed transaction due to cluster-wide conflicts, before returning an error to the client. If set to 0, no retries will be attempted, while a value of 1 (the default) or more specifies the number of retries attempted. This can be useful to assist applications using autocommit to avoid deadlocks.

ClusterControl
Single Console for Your Entire Database Infrastructure
Find out what else is new in ClusterControl

Node Consensus and Failover

Galera uses Group Communication System (GCS) to check node consensus and availability between cluster members. If a node is unhealthy, it will be automatically evicted from the cluster after gmcast.peer_timeout value, default to 3 seconds. A healthy Galera node in "Synced" state is deemed as a reliable node to serve reads and writes, while others are not. This design greatly simplifies health check procedures from the upper tiers (load balancer or application).

In MySQL replication, a master does not care about its slave(s), while a slave only has consensus with its sole master via the slave_IO_thread process when replicating the binary events from master's binary log. If a master goes down, this will break the replication and an attempt to re-establish the link will be made every slave_net_timeout (default to 60 seconds). From the application or load balancer perspective, the health check procedures for replication slave must at least involve checking the following state:

  • Seconds_Behind_Master
  • Slave_IO_Running
  • Slave_SQL_Running
  • read_only variable
  • super_read_only variable (MySQL 5.7.8 and later)

In terms of failover, generally, master-master replication and Galera nodes are equal. They hold the same data set (albeit you can replicate a subset of data in MySQL replication, but that's uncommon for master-master) and share the same role as masters, capable of handling reads and writes simultaneously. Therefore, there is actually no failover from the database point-of-view due to this equilibrium. Only from the application side that would require failover to skip the unoperational nodes. Keep in mind that because MySQL replication is asynchronous, it is possible that not all of the changes done on the master will have propagated to the other master.

Node Provisioning

The process of bringing a node into sync with the cluster before replication starts, is known as provisioning. In MySQL replication, provisioning a new node is a manual process. One has to take a backup of the master and restore it over to the new node before setting up the replication link. For an existing replication node, if the master's binary logs have been rotated (based on expire_logs_days, default to 0 means no automatic removal), you may have to re-provision the node using this procedure. There are also external tools like Percona Toolkit pt-table-sync and ClusterControl to help you out on this. ClusterControl supports resyncing a slave with just two clicks. You have options to resync by taking a backup from the active master or an existing backup.

In Galera, there are two ways of doing this - incremental state transfer (IST) or state snapshot transfer (SST). IST process is the preferred method where only the missing transactions transfer from a donor's cache. SST process is similar to taking a full backup from the donor, it is usually pretty resource intensive. Galera will automatically determine which syncing process to trigger based on the joiner's state. In most cases, if a node fails to join a cluster, simply wipe out the MySQL datadir of the problematic node and start the MySQL service. Galera provisioning process is much simpler, it comes very handy when scaling out your cluster or re-introducing a problematic node back into the cluster.

Loosely Coupled vs Tightly Coupled

MySQL replication works very well even across slower connections, and with connections that are not continuous. It can also be used across different hardware, environment and operating systems. Most storage engines support it, including MyISAM, Aria, MEMORY and ARCHIVE. This loosely coupled setup allows MySQL master-master replication to work well in a mixed environment with less restriction.

Galera nodes are tightly-coupled, where the replication performance is as fast as the slowest node. Galera uses a flow control mechanism to control replication flow among members and eliminate any slave lag. The replication can be all fast or all slow on every node and is adjusted automatically by Galera. Thus, it's recommended to use uniform hardware specs for all Galera nodes, especially with respect to CPU, RAM, disk subsystem, network interface card and network latency between nodes in the cluster.

Conclusions

In summary, Galera Cluster is superior if compared to MySQL master-master replication due to its synchronous replication support with strong consistency, plus more advanced features like automatic membership control, automatic node provisioning and multi-threaded slaves. Ultimately, this depends on how the application interacts with the database server. Some legacy applications built for a standalone database server may not work well on a clustered setup.

To simplify our points above, the following reasons justify when to use MySQL master-master replication:

  • Things that are not supported by Galera:
    • Replication for non-InnoDB/XtraDB tables like MyISAM, Aria, MEMORY or ARCHIVE.
    • XA transactions.
    • Statement-based replication between masters (e.g, when bandwidth is very expensive).
    • Relying on explicit locking like LOCK TABLES statement.
    • The general query log and the slow query log must be directed to a table, instead of a file.
  • Loosely coupled setup where the hardware specs, software version and connection speed are significantly different on every master.
  • When you already have a MySQL replication chain and you want to add another active/backup master for redundancy to speed up failover and recovery time in case if one of the master is unavailable.
  • If your application can't be modified to work around Galera Cluster limitations and having a MySQL-aware load balancer like ProxySQL or MaxScale is not an option.

Reasons to pick Galera Cluster over MySQL master-master replication:

  • Ability to safely write to multiple masters.
  • Data consistency automatically managed (and guaranteed) across databases.
  • New database nodes easily introduced and synced.
  • Failures or inconsistencies automatically detected.
  • In general, more advanced and robust high availability features.

An Introduction to Database High Availability for MySQL & MariaDB

$
0
0

The following is an excerpt from our whitepaper “How to Design Highly Available Open Source Database Environments” which can be downloaded for free.


A Couple of Words on “High Availability”

These days high availability is a must for any serious deployment. Long gone are days when you could schedule a downtime of your database for several hours to perform a maintenance. If your services are not available, you are losing customers and money. Therefore making a database environment highly available has typically one of the highest priorities.

This poses a significant challenge to database administrators. First of all, how do you tell if your environment is highly available or not? How would you measure it? What are the steps you need to take in order to improve availability? How to design your setup to make it highly available from the beginning?

There are many many HA solutions available in the MySQL (and MariaDB) ecosystem, but how do we know which ones we can trust? Some solutions might work under certain specific conditions, but might cause more trouble when applied outside of these conditions. Even a basic functionality like MySQL replication, which can be configured in many ways, can cause significant harm - for instance, circular replication with multiple writeable masters. Although it is easy to set up a ‘multi-master setup’ using replication, it can very easily break and leave us with diverging datasets on different servers. For a database, which is often considered the single source of truth, compromised data integrity can have catastrophic consequences.

In the following chapters, we’ll discuss the requirements for high availability in database
setups, and how to design the system from the ground up.

Measuring High Availability

What is high availability? To be able to decide if a given environment is highly available or not, one has to have some metrics for that. There are numerous ways you can measure high availability, we’ll focus on some of the most basic stuff.

First, though, let’s think what this whole high availability is all about? What is its purpose? It is about making sure your environment serves its purpose. Purpose can be defined in many ways but, typically, it will be about delivering some service. In the database world, typically it’s somewhat related to data. It could be serving data to your internal application. It can be to store data and make it queryable by analytical processes. It can be to store some data for your users, and provide it when requested on demand. Once we are clear about the purpose, we can establish the success factors involved. This will help us define what high availability means in our specific case.

SLA’s

Service Level Agreement (SLA). It is also quite common to define SLA’s for internal services. What is an SLA? It is a definition of the service level you plan to provide to your customers. This is for them to better understand what level of stability you plan for a service they bought or are planning to buy. There are numerous methods you can leverage to prepare a SLA but typical ones are:

  • Availability of the service (percent)
  • Responsiveness of the service - latency (average, max, 95 percentile, 99 percentile)
  • Packet loss over the network (percent)
  • Throughput (average, minimum, 95 percentile, 99 percentile)
     

It can get more complex than that, though. In a sharded, multi-user environment you can define, let’s say, your SLA as: “Service will be available 99,99% of the time, downtime is declared when more than 2% of the users is affected. No incident can take more than 15 minutes to be resolved”. Such SLA can also be extended to incorporate query response time: “downtime is called if 99 percentile of latency for queries excede 200 milliseconds”.

Nines

Availability is typically measured in “nines”, let us look into what exactly a given amount of “nines” guarantees. The table below is taken from Wikipedia:

Availability %Downtime per yearDowntime per monthDowntime per weekDowntime per day
90%
("one nine")
36.5 days72 hours16.8 hours2.4 hours
95%
("one and a half nines")
18.25 days36 hours8.4 hours1.2 hours
97%10.96 days21.6 hours5.04 hours43.2 min
98%7.30 days14.4 hours3.36 hours28.8 min
99%
("two nines")
3.65 days7.20 hours1.68 hours14.4 min
99.5%
("two and a half nines")
1.83 days3.60 hours50.4 min7.2 min
99.8%17.52 hours86.23 min20.16 min2.88 min
99.9%
("three nines")
8.76 hours43.8 min10.1 min1.44 min
99.95%
("three and a half nines")
4.38 hours21.56 min5.04 min43.2 s
99.99%
("four nines")
52.56 min4.38 min1.01 min8.64 s
99.995%
("four and a half nines")
26.28 min2.16 min30.24 s4.32 s
99.999%
("five nines")
5.26 min25.9 s6.05 s864.3 ms
99.9999%
("six nines")
31.5 s2.59 s604.8 ms86.4 ms
99.99999%
("seven nines")
3.15 s262.97 ms60.48 ms8.64 ms
99.999999%
("eight nines")
315.569 ms26.297 ms6.048 ms0.864 ms
99.9999999%
("nine nines")
31.5569 ms2.6297 ms0.6048 ms0.0864 ms

As we can see, it escalates quickly. Five nines (99,999% availability) is equivalent to 5.26 minutes of downtime over the course of a year. Availability can also be calculated in different, smaller ranges: per month, per week, per day. Keep in mind those numbers, as they will be useful when we start to discuss the costs associated with maintaining different levels of availability.

Measuring Availability

To tell if there is a downtime or not, one has to have insight into the environment. You need to track the metrics which define the availability of your systems. It is important to keep in mind that you should measure it from a customer’s point of view, taking the broader picture under consideration. It doesn’t matter if your databases are up if, let’s say, due to a network issue, no application cannot reach them. Every single building block of your setup has its impact on availability.

One of the good places where to look for availability data is web server logs. All requests which ended up with errors mean something has happened. It could be HTTP error 500 returned by the application, because the database connection failed. Those could be programmatic errors pointing to some database issues, and which ended up in Apache’s error log. You can also use simple metric as uptime of database servers, although, with more complex SLA’s it might be tricky to determine how the unavailability of one database impacted your user base. No matter what you do, you should use more than one metric - this is needed to capture issues which might have happened on different layers of your environment.

Magic Number: “Three”

Even though high availability is also about redundancy, in case of database clusters, three is a magic number. It is not enough to have two nodes for redundancy - such setup does not provide any built-in high availability. Sure, it might be better than just a single node, but human intervention is required to recover services. Let’s see why it is so.

Let’s assume we have two nodes, A and B. There’s a network link between them. Let us assume that both A and B serves writes and the application randomly picks where to connect (which means that part of the application will connect to node A and the other part will connect to node B). Now, let’s imagine we have a network issue which results in lost network connectivity between A and B.

What now? Neither A nor B can know the state of the other node. There are two actions which can be taken by both nodes:

  1. They can continue accepting traffic
  2. They can cease to operate and refuse to serve any traffic

Let’s think about the first option. As long as the other node is indeed down, this is the preferred action to take - we want our database to continue serving traffic. This is the main idea behind high availability after all. What would happen, though, if both nodes would continue to accept traffic while being disconnected from each other? New data will be added on both sides, and the datasets will get out of sync. When the network issue will be resolved, it will be a daunting task to merge those two datasets. Therefore, it is not acceptable to keep both nodes up and running. The problem is - how can node A tell if node B is alive or not (and vice versa)? The answer is - it cannot. If all connectivity is down, there is no way to distinguish a failed node from a failed network. As a result, the only safe action is for both nodes to cease all operations and refuse to
serve traffic.

Let’s think now how a third node can help us in such a situation.

So we now have three nodes: A, B and C. All are interconnected, all are handling reads and writes.

Again, as in the previous example, node B has been cut off from the rest of the cluster due to network issues. What can happen next? Well, the situation is fairly similar to what we discussed earlier. Two options - node B can either be down (and the rest of the cluster should continue) or it can be up, in which case it shouldn’t be allowed to handle any traffic. Can we now tell what’s the state of the cluster? Actually, yes. We can see that nodes A and C can talk to each other and, as a result, they can agree that node B is not available. They won’t be able to tell why it happened, but what they know is that out of three nodes in the cluster two still have connectivity between each other. Given that those two nodes form a majority of the cluster, it makes possible to continue handling traffic. At the same time node B can also deduct that the problem is on its side. It cannot access neither node A nor node C, making node B separated from the rest of the cluster. As it is isolated and is not part of a majority (1 of 3), the only safe action it can take is to stop serving traffic and refuse to accept any queries, ensuring that data drift won’t happen.

Of course, it doesn’t mean you can have only three nodes in the cluster. If you want better failure tolerance, you may want to add more. Keep in mind, though, it should be an odd number if you want to improve high availability. Also, we were talking about “nodes” in the examples above. Please keep in mind that this is also true for datacenters, availability zones etc. If you have two datacenters, each having the same number of nodes (let’s say three nodes each), and you lose connectivity between those two DC’s, same principles apply here - you cannot tell which half of the cluster should start handling traffic. To be able to tell that, you have to have an observer in a third datacenter. It can be yet another set of nodes, or just a single host, with the task
to observe the state of remaining dataceters and take part in making decisions (an example here would be the Galera arbitrator).

Single Points of Failure

High availability is all about removing single points of failure (SPOF) and not introducing new ones in the process. What are the SPOFs? Any part of your infrastructure which, when failed, brings downtime as defined in SLA, is called a SPOF. Infrastructure design requires a holistic approach, the different components cannot be designed independently of each other. Most likely, you are not responsible for the whole design -
database administrators tend to focus on databases and not, for example, the network layer. Still, you have to keep the other parts in mind and work with the teams which are responsible for them, to make sure that not only the part you are responsible for is designed correctly but also that the remaining bits of the infrastructure were designed using the same principles. On top of that, such knowledge of how the whole
infrastructure is designed, helps you to design the database stack too. Knowing what issues may happen helps to build some mechanisms to prevent them from impacting the availability of the database.

How to Run and Configure ProxySQL 2.0 for MySQL Galera Cluster on Docker

$
0
0

ProxySQL is an intelligent and high-performance SQL proxy which supports MySQL, MariaDB and ClickHouse. Recently, ProxySQL 2.0 has become GA and it comes with new exciting features such as GTID consistent reads, frontend SSL, Galera and MySQL Group Replication native support.

It is relatively easy to run ProxySQL as Docker container. We have previously written about how to run ProxySQL on Kubernetes as a helper container or as a Kubernetes service, which is based on ProxySQL 1.x. In this blog post, we are going to use the new version ProxySQL 2.x which uses a different approach for Galera Cluster configuration.

ProxySQL 2.x Docker Image

We have released a new ProxySQL 2.0 Docker image container and it's available in Docker Hub. The README provides a number of configuration examples particularly for Galera and MySQL Replication, pre and post v2.x. The configuration lines can be defined in a text file and mapped into the container's path at /etc/proxysql.cnf to be loaded into ProxySQL service.

The image "latest" tag still points to 1.x until ProxySQL 2.0 officially becomes GA (we haven't seen any official release blog/article from ProxySQL team yet). Which means, whenever you install ProxySQL image using latest tag from Severalnines, you will still get version 1.x with it. Take note the new example configurations also enable ProxySQL web stats (introduced in 1.4.4 but still in beta) - a simple dashboard that summarizes the overall configuration and status of ProxySQL itself.

ProxySQL 2.x Support for Galera Cluster

Let's talk about Galera Cluster native support in greater detail. The new mysql_galera_hostgroups table consists of the following fields:

  • writer_hostgroup: ID of the hostgroup that will contain all the members that are writers (read_only=0).
  • backup_writer_hostgroup: If the cluster is running in multi-writer mode (i.e. there are multiple nodes with read_only=0) and max_writers is set to a smaller number than the total number of nodes, the additional nodes are moved to this backup writer hostgroup.
  • reader_hostgroup: ID of the hostgroup that will contain all the members that are readers (i.e. nodes that have read_only=1)
  • offline_hostgroup: When ProxySQL monitoring determines a host to be OFFLINE, the host will be moved to the offline_hostgroup.
  • active: a boolean value (0 or 1) to activate a hostgroup
  • max_writers: Controls the maximum number of allowable nodes in the writer hostgroup, as mentioned previously, additional nodes will be moved to the backup_writer_hostgroup.
  • writer_is_also_reader: When 1, a node in the writer_hostgroup will also be placed in the reader_hostgroup so that it will be used for reads. When set to 2, the nodes from backup_writer_hostgroup will be placed in the reader_hostgroup, instead of the node(s) in the writer_hostgroup.
  • max_transactions_behind: determines the maximum number of writesets a node in the cluster can have queued before the node is SHUNNED to prevent stale reads (this is determined by querying the wsrep_local_recv_queue Galera variable).
  • comment: Text field that can be used for any purposes defined by the user

Here is an example configuration for mysql_galera_hostgroups in table format:

Admin> select * from mysql_galera_hostgroups\G
*************************** 1. row ***************************
       writer_hostgroup: 10
backup_writer_hostgroup: 20
       reader_hostgroup: 30
      offline_hostgroup: 9999
                 active: 1
            max_writers: 1
  writer_is_also_reader: 2
max_transactions_behind: 20
                comment: 

ProxySQL performs Galera health checks by monitoring the following MySQL status/variable:

  • read_only - If ON, then ProxySQL will group the defined host into reader_hostgroup unless writer_is_also_reader is 1.
  • wsrep_desync - If ON, ProxySQL will mark the node as unavailable, moving it to offline_hostgroup.
  • wsrep_reject_queries - If this variable is ON, ProxySQL will mark the node as unavailable, moving it to the offline_hostgroup (useful in certain maintenance situations).
  • wsrep_sst_donor_rejects_queries - If this variable is ON, ProxySQL will mark the node as unavailable while the Galera node is serving as an SST donor, moving it to the offline_hostgroup.
  • wsrep_local_state - If this status returns other than 4 (4 means Synced), ProxySQL will mark the node as unavailable and move it into offline_hostgroup.
  • wsrep_local_recv_queue - If this status is higher than max_transactions_behind, the node will be shunned.
  • wsrep_cluster_status - If this status returns other than Primary, ProxySQL will mark the node as unavailable and move it into offline_hostgroup.

Having said that, by combining these new parameters in mysql_galera_hostgroups together with mysql_query_rules, ProxySQL 2.x has the flexibility to fit into much more Galera use cases. For example, one can have a single-writer, multi-writer and multi-reader hostgroups defined as the destination hostgroup of a query rule, with the ability to limit the number of writers and finer control on the stale reads behaviour.

Contrast this to ProxySQL 1.x, where the user had to explicitly define a scheduler to call an external script to perform the backend health checks and update the database servers state. This requires some customization to the script (user has to update the ProxySQL admin user/password/port) plus it depended on an additional tool (MySQL client) to connect to ProxySQL admin interface.

Here is an example configuration of Galera health check script scheduler in table format for ProxySQL 1.x:

Admin> select * from scheduler\G
*************************** 1. row ***************************
         id: 1
     active: 1
interval_ms: 2000
   filename: /usr/share/proxysql/tools/proxysql_galera_checker.sh
       arg1: 10
       arg2: 20
       arg3: 1
       arg4: 1
       arg5: /var/lib/proxysql/proxysql_galera_checker.log
    comment:

Besides, since ProxySQL scheduler thread executes any script independently, there are many versions of health check scripts available out there. All ProxySQL instances deployed by ClusterControl uses the default script provided by the ProxySQL installer package.

In ProxySQL 2.x, max_writers and writer_is_also_reader variables can determine how ProxySQL dynamically groups the backend MySQL servers and will directly affect the connection distribution and query routing. For example, consider the following MySQL backend servers:

Admin> select hostgroup_id, hostname, status, weight from mysql_servers;
+--------------+--------------+--------+--------+
| hostgroup_id | hostname     | status | weight |
+--------------+--------------+--------+--------+
| 10           | DB1          | ONLINE | 1      |
| 10           | DB2          | ONLINE | 1      |
| 10           | DB3          | ONLINE | 1      |
+--------------+--------------+--------+--------+

Together with the following Galera hostgroups definition:

Admin> select * from mysql_galera_hostgroups\G
*************************** 1. row ***************************
       writer_hostgroup: 10
backup_writer_hostgroup: 20
       reader_hostgroup: 30
      offline_hostgroup: 9999
                 active: 1
            max_writers: 1
  writer_is_also_reader: 2
max_transactions_behind: 20
                comment: 

Considering all hosts are up and running, ProxySQL will most likely group the hosts as below:

Let's look at them one by one:

ConfigurationDescription
writer_is_also_reader=0
  • Groups the hosts into 2 hostgroups (writer and backup_writer).
  • Writer is part of the backup_writer.
  • Since the writer is not a reader, nothing in hostgroup 30 (reader) because none of the hosts are set with read_only=1. It is not a common practice in Galera to enable the read-only flag.
writer_is_also_reader=1
  • Groups the hosts into 3 hostgroups (writer, backup_writer and reader).
  • Variable read_only=0 in Galera has no affect thus writer is also in hostgroup 30 (reader)
  • Writer is not part of backup_writer.
writer_is_also_reader=2
  • Similar with writer_is_also_reader=1 however, writer is part of backup_writer.

With this configuration, one can have various choices for hostgroup destination to cater for specific workloads. "Hotspot" writes can be configured to go to only one server to reduce multi-master conflicts, non-conflicting writes can be distributed equally on the other masters, most reads can be distributed evenly on all MySQL servers or non-writers, critical reads can be forwarded to the most up-to-date servers and analytical reads can be forwarded to a slave replica.

ProxySQL Deployment for Galera Cluster

In this example, suppose we already have a three-node Galera Cluster deployed by ClusterControl as shown in the following diagram:

Our Wordpress applications are running on Docker while the Wordpress database is hosted on our Galera Cluster running on bare-metal servers. We decided to run a ProxySQL container alongside our Wordpress containers to have a better control on Wordpress database query routing and fully utilize our database cluster infrastructure. Since the read-write ratio is around 80%-20%, we want to configure ProxySQL to:

  • Forward all writes to one Galera node (less conflict, focus on write)
  • Balance all reads to the other two Galera nodes (better distribution for the majority of the workload)

Firstly, create a ProxySQL configuration file inside the Docker host so we can map it into our container:

$ mkdir /root/proxysql-docker
$ vim /root/proxysql-docker/proxysql.cnf

Then, copy the following lines (we will explain the configuration lines further down):

datadir="/var/lib/proxysql"

admin_variables=
{
    admin_credentials="admin:admin"
    mysql_ifaces="0.0.0.0:6032"
    refresh_interval=2000
    web_enabled=true
    web_port=6080
    stats_credentials="stats:admin"
}

mysql_variables=
{
    threads=4
    max_connections=2048
    default_query_delay=0
    default_query_timeout=36000000
    have_compress=true
    poll_timeout=2000
    interfaces="0.0.0.0:6033;/tmp/proxysql.sock"
    default_schema="information_schema"
    stacksize=1048576
    server_version="5.1.30"
    connect_timeout_server=10000
    monitor_history=60000
    monitor_connect_interval=200000
    monitor_ping_interval=200000
    ping_interval_server_msec=10000
    ping_timeout_server=200
    commands_stats=true
    sessions_sort=true
    monitor_username="proxysql"
    monitor_password="proxysqlpassword"
    monitor_galera_healthcheck_interval=2000
    monitor_galera_healthcheck_timeout=800
}

mysql_galera_hostgroups =
(
    {
        writer_hostgroup=10
        backup_writer_hostgroup=20
        reader_hostgroup=30
        offline_hostgroup=9999
        max_writers=1
        writer_is_also_reader=1
        max_transactions_behind=30
        active=1
    }
)

mysql_servers =
(
    { address="db1.cluster.local" , port=3306 , hostgroup=10, max_connections=100 },
    { address="db2.cluster.local" , port=3306 , hostgroup=10, max_connections=100 },
    { address="db3.cluster.local" , port=3306 , hostgroup=10, max_connections=100 }
)

mysql_query_rules =
(
    {
        rule_id=100
        active=1
        match_pattern="^SELECT .* FOR UPDATE"
        destination_hostgroup=10
        apply=1
    },
    {
        rule_id=200
        active=1
        match_pattern="^SELECT .*"
        destination_hostgroup=20
        apply=1
    },
    {
        rule_id=300
        active=1
        match_pattern=".*"
        destination_hostgroup=10
        apply=1
    }
)

mysql_users =
(
    { username = "wordpress", password = "passw0rd", default_hostgroup = 10, transaction_persistent = 0, active = 1 },
    { username = "sbtest", password = "passw0rd", default_hostgroup = 10, transaction_persistent = 0, active = 1 }
)

Now, let's pay a visit to some of the most configuration sections. Firstly, we define the Galera hostgroups configuration as below:

mysql_galera_hostgroups =
(
    {
        writer_hostgroup=10
        backup_writer_hostgroup=20
        reader_hostgroup=30
        offline_hostgroup=9999
        max_writers=1
        writer_is_also_reader=1
        max_transactions_behind=30
        active=1
    }
)

Hostgroup 10 will be the writer_hostgroup, hostgroup 20 for backup_writer and hostgroup 30 for reader. We set max_writers to 1 so we can have a single-writer hostgroup for hostgroup 10 where all writes should be sent to. Then, we define writer_is_also_reader to 1 which will make all Galera nodes as reader as well, suitable for queries that can be equally distributed to all nodes. Hostgroup 9999 is reserved for offline_hostgroup if ProxySQL detects unoperational Galera nodes.

Then, we configure our MySQL servers with default to hostgroup 10:

mysql_servers =
(
    { address="db1.cluster.local" , port=3306 , hostgroup=10, max_connections=100 },
    { address="db2.cluster.local" , port=3306 , hostgroup=10, max_connections=100 },
    { address="db3.cluster.local" , port=3306 , hostgroup=10, max_connections=100 }
)

With the above configurations, ProxySQL will "see" our hostgroups as below:

Then, we define the query routing through query rules. Based on our requirement, all reads should be sent to all Galera nodes except the writer (hostgroup 20) and everything else is forwarded to hostgroup 10 for single writer:

mysql_query_rules =
(
    {
        rule_id=100
        active=1
        match_pattern="^SELECT .* FOR UPDATE"
        destination_hostgroup=10
        apply=1
    },
    {
        rule_id=200
        active=1
        match_pattern="^SELECT .*"
        destination_hostgroup=20
        apply=1
    },
    {
        rule_id=300
        active=1
        match_pattern=".*"
        destination_hostgroup=10
        apply=1
    }
)

Finally, we define the MySQL users that will be passed through ProxySQL:

mysql_users =
(
    { username = "wordpress", password = "passw0rd", default_hostgroup = 10, transaction_persistent = 0, active = 1 },
    { username = "sbtest", password = "passw0rd", default_hostgroup = 10, transaction_persistent = 0, active = 1 }
)

We set transaction_persistent to 0 so all connections coming from these users will respect the query rules for reads and writes routing. Otherwise, the connections would end up hitting one hostgroup which defeats the purpose of load balancing. Do not forget to create those users first on all MySQL servers. For ClusterControl user, you may use Manage -> Schemas and Users feature to create those users.

We are now ready to start our container. We are going to map the ProxySQL configuration file as bind mount when starting up the ProxySQL container. Thus, the run command will be:

$ docker run -d \
--name proxysql2 \
--hostname proxysql2 \
--publish 6033:6033 \
--publish 6032:6032 \
--publish 6080:6080 \
--restart=unless-stopped \
-v /root/proxysql/proxysql.cnf:/etc/proxysql.cnf \
severalnines/proxysql:2.0

Finally, change the Wordpress database pointing to ProxySQL container port 6033, for instance:

$ docker run -d \
--name wordpress \
--publish 80:80 \
--restart=unless-stopped \
-e WORDPRESS_DB_HOST=proxysql2:6033 \
-e WORDPRESS_DB_USER=wordpress \
-e WORDPRESS_DB_HOST=passw0rd \
wordpress

At this point, our architecture is looking something like this:

If you want ProxySQL container to be persistent, map /var/lib/proxysql/ to a Docker volume or bind mount, for example:

$ docker run -d \
--name proxysql2 \
--hostname proxysql2 \
--publish 6033:6033 \
--publish 6032:6032 \
--publish 6080:6080 \
--restart=unless-stopped \
-v /root/proxysql/proxysql.cnf:/etc/proxysql.cnf \
-v proxysql-volume:/var/lib/proxysql \
severalnines/proxysql:2.0

Keep in mind that running with persistent storage like the above will make our /root/proxysql/proxysql.cnf obsolete on the second restart. This is due to ProxySQL multi-layer configuration whereby if /var/lib/proxysql/proxysql.db exists, ProxySQL will skip loading options from configuration file and load whatever is in the SQLite database instead (unless you start proxysql service with --initial flag). Having said that, the next ProxySQL configuration management has to be performed via ProxySQL admin console on port 6032, instead of using configuration file.

Monitoring

ProxySQL process log by default logging to syslog and you can view them by using standard docker command:

$ docker ps
$ docker logs proxysql2

To verify the current hostgroup, query the runtime_mysql_servers table:

$ docker exec -it proxysql2 mysql -uadmin -padmin -h127.0.0.1 -P6032 --prompt='Admin> '
Admin> select hostgroup_id,hostname,status from runtime_mysql_servers;
+--------------+--------------+--------+
| hostgroup_id | hostname     | status |
+--------------+--------------+--------+
| 10           | 192.168.0.21 | ONLINE |
| 30           | 192.168.0.21 | ONLINE |
| 30           | 192.168.0.22 | ONLINE |
| 30           | 192.168.0.23 | ONLINE |
| 20           | 192.168.0.22 | ONLINE |
| 20           | 192.168.0.23 | ONLINE |
+--------------+--------------+--------+

If the selected writer goes down, it will be transferred to the offline_hostgroup (HID 9999):

Admin> select hostgroup_id,hostname,status from runtime_mysql_servers;
+--------------+--------------+--------+
| hostgroup_id | hostname     | status |
+--------------+--------------+--------+
| 10           | 192.168.0.22 | ONLINE |
| 9999         | 192.168.0.21 | ONLINE |
| 30           | 192.168.0.22 | ONLINE |
| 30           | 192.168.0.23 | ONLINE |
| 20           | 192.168.0.23 | ONLINE |
+--------------+--------------+--------+

The above topology changes can be illustrated in the following diagram:

We have also enabled the web stats UI with admin-web_enabled=true.To access the web UI, simply go to the Docker host in port 6080, for example: http://192.168.0.200:8060 and you will be prompted with username/password pop up. Enter the credentials as defined under admin-stats_credentials and you should see the following page:

By monitoring MySQL connection pool table, we can get connection distribution overview for all hostgroups:

Admin> select hostgroup, srv_host, status, ConnUsed, MaxConnUsed, Queries from stats.stats_mysql_connection_pool order by srv_host;
+-----------+--------------+--------+----------+-------------+---------+
| hostgroup | srv_host     | status | ConnUsed | MaxConnUsed | Queries |
+-----------+--------------+--------+----------+-------------+---------+
| 20        | 192.168.0.23 | ONLINE | 5        | 24          | 11458   |
| 30        | 192.168.0.23 | ONLINE | 0        | 0           | 0       |
| 20        | 192.168.0.22 | ONLINE | 2        | 24          | 11485   |
| 30        | 192.168.0.22 | ONLINE | 0        | 0           | 0       |
| 10        | 192.168.0.21 | ONLINE | 32       | 32          | 9746    |
| 30        | 192.168.0.21 | ONLINE | 0        | 0           | 0       |
+-----------+--------------+--------+----------+-------------+---------+

The output above shows that hostgroup 30 does not process anything because our query rules do not have this hostgroup configured as destination hostgroup.

The statistics related to the Galera nodes can be viewed in the mysql_server_galera_log table:

Admin>  select * from mysql_server_galera_log order by time_start_us desc limit 3\G
*************************** 1. row ***************************
                       hostname: 192.168.0.23
                           port: 3306
                  time_start_us: 1552992553332489
                success_time_us: 2045
              primary_partition: YES
                      read_only: NO
         wsrep_local_recv_queue: 0
              wsrep_local_state: 4
                   wsrep_desync: NO
           wsrep_reject_queries: NO
wsrep_sst_donor_rejects_queries: NO
                          error: NULL
*************************** 2. row ***************************
                       hostname: 192.168.0.22
                           port: 3306
                  time_start_us: 1552992553329653
                success_time_us: 2799
              primary_partition: YES
                      read_only: NO
         wsrep_local_recv_queue: 0
              wsrep_local_state: 4
                   wsrep_desync: NO
           wsrep_reject_queries: NO
wsrep_sst_donor_rejects_queries: NO
                          error: NULL
*************************** 3. row ***************************
                       hostname: 192.168.0.21
                           port: 3306
                  time_start_us: 1552992553329013
                success_time_us: 2715
              primary_partition: YES
                      read_only: NO
         wsrep_local_recv_queue: 0
              wsrep_local_state: 4
                   wsrep_desync: NO
           wsrep_reject_queries: NO
wsrep_sst_donor_rejects_queries: NO
                          error: NULL

The resultset returns the related MySQL variable/status state for every Galera node for a particular timestamp. In this configuration, we configured the Galera health check to run every 2 seconds (monitor_galera_healthcheck_interval=2000). Hence, the maximum failover time would be around 2 seconds if a topology change happens to the cluster.

References

Understanding the Effects of High Latency in High Availability MySQL and MariaDB Solutions

$
0
0

High availability is a high percentage of time that the system is working and responding according to the business needs. For production database systems it is typically the highest priority to keep it close to 100%. We build database clusters to eliminate all single point of failure. If an instance becomes unavailable, another node should be able to take the workload and carry on from there. In a perfect world, a database cluster would solve all of our system availability problems. Unfortunately, while all may look good on paper, the reality is often different. So where can it go wrong?

Transactional databases systems come with sophisticated storage engines. Keeping data consistent across multiple nodes makes this task way harder. Clustering introduces a number of new variables that highly depend on network and underlying infrastructure. It is not uncommon for a standalone database instance that was running fine on a single node suddenly performs poorly in a cluster environment.

Among the number of things that can affect cluster availability, latency issues play a crucial role. However, what is the latency? Is it only related to the network?

The term "latency" actually refers to several kinds of delays incurred in the processing of data. It’s how long it takes for a piece of information to move from stage to another.

In this blog post, we’ll look at the two main high availability solutions for MySQL and MariaDB, and how they can each be affected by latency issues.

At the end of the article, we take a look at modern load balancers and discuss how they can help you address some types of latency issues.

In a previous article, my colleague Krzysztof Książek wrote about "Dealing with Unreliable Networks When Crafting an HA Solution for MySQL or MariaDB". You will find tips which can help you to design your production ready HA architecture, and avoid some of the issues described here.

Master-Slave replication for High Availability.

MySQL master-slave replication is probably the most popular database cluster type on the planet. One of the main things you want to monitor while running your master-slave replication cluster is the slave lag. Depending on your application requirements and the way how you utilize your database, the replication latency (slave lag) may determine if the data can be read from the slave node or not. Data committed on master but not yet available on an asynchronous slave means that the slave has an older state. When it’s not ok to read from a slave, you would need to go to the master, and that can affect application performance. In the worst case scenario, your system will not be able to handle all the workload on a master.

Slave lag and stale data

To check the status of the master-slave replication, you should start with below command:

SHOW SLAVE STATUS\G
MariaDB [(none)]> show slave status\G
*************************** 1. row ***************************
               Slave_IO_State: Waiting for master to send event
                  Master_Host: 10.0.3.100
                  Master_User: rpl_user
                  Master_Port: 3306
                Connect_Retry: 10
              Master_Log_File: binlog.000021
          Read_Master_Log_Pos: 5101
               Relay_Log_File: relay-bin.000002
                Relay_Log_Pos: 809
        Relay_Master_Log_File: binlog.000021
             Slave_IO_Running: Yes
            Slave_SQL_Running: Yes
              Replicate_Do_DB: 
          Replicate_Ignore_DB: 
           Replicate_Do_Table: 
       Replicate_Ignore_Table: 
      Replicate_Wild_Do_Table: 
  Replicate_Wild_Ignore_Table: 
                   Last_Errno: 0
                   Last_Error: 
                 Skip_Counter: 0
          Exec_Master_Log_Pos: 5101
              Relay_Log_Space: 1101
              Until_Condition: None
               Until_Log_File: 
                Until_Log_Pos: 0
           Master_SSL_Allowed: No
           Master_SSL_CA_File: 
           Master_SSL_CA_Path: 
              Master_SSL_Cert: 
            Master_SSL_Cipher: 
               Master_SSL_Key: 
        Seconds_Behind_Master: 0
Master_SSL_Verify_Server_Cert: No
                Last_IO_Errno: 0
                Last_IO_Error: 
               Last_SQL_Errno: 0
               Last_SQL_Error: 
  Replicate_Ignore_Server_Ids: 
             Master_Server_Id: 3
               Master_SSL_Crl: 
           Master_SSL_Crlpath: 
                   Using_Gtid: Slave_Pos
                  Gtid_IO_Pos: 0-3-1179
      Replicate_Do_Domain_Ids: 
  Replicate_Ignore_Domain_Ids: 
                Parallel_Mode: conservative
1 row in set (0.01 sec)

Using the above information you can determine how good the overall replication latency is. The lower the value you see in "Seconds_Behind_Master", the better the data transfer speed for replication.

Another way to monitor slave lag is to use ClusterControl replication monitoring. In this screenshot we can see the replication status of asymchoronous Master-Slave (2x) Cluster with ProxySQL.

There are a number of things that can affect replication time. The most obvious is the network throughput and how much data you can transfer. MySQL comes with multiple configuration options to optimize replication process. The essential replication related parameters are:

  • Parallel apply
  • Logical clock algorithm
  • Compression
  • Selective master-slave replication
  • Replication mode

Parallel apply

It’s not uncommon to start replication tuning with enabling parallel process apply. The reason for that is by default, MySQL goes with sequential binary log apply, and a typical database server comes with several CPUs to use.

To get around sequential log apply, both MariaDB and MySQL offer parallel replication. The implementation may differ per vendor and version. E.g. MySQL 5.6 offers parallel replication as long as a schema separates the queries while MariaDB (starting version 10.0) and MySQL 5.7 both can handle parallel replication across schemas. Different vendors and versions come with their limitations and feature so always check the documentation.

Executing queries via parallel slave threads may speed up your replication stream if you are write heavy. However, if you aren’t, it would be best to stick to the traditional single-threaded replication. To enable parallel processing, change the slave_parallel_workers to the number of CPU threads you want to involve in the process. It is recommended to keep the value lower of the number of available CPU threads.

Parallel replication works best with the group commits. To check if you have group commits happening run following query.

show global status like 'binlog_%commits';

The bigger the ratio between these two values the better.

Logical clock

The slave_parallel_type=LOGICAL_CLOCK is an implementation of a Lamport clock algorithm. When using a multithreaded slave this variable specifies the method used to decide which transactions are allowed to execute in parallel on the slave. The variable has no effect on slaves for which multithreading is not enabled so make sure slave_parallel_workers is set higher than 0.

MariaDB users should also check optimistic mode introduced in version 10.1.3 as it also may give you better results.

GTID

MariaDB comes with its own implementation of GTID. MariaDB’s sequence consists of a domain, server, and transaction. Domains allow multi-source replication with distinct ID. Different domain ID’s can be used to replicate the portion of data out-of-order (in parallel). As long it’s okayish for your application this can reduce replication latency.

The similar technique applies to MySQL 5.7 which can also use the multisource master and independent replication channels.

Compression

CPU power is getting less expensive over time, so using it for binlog compression could be a good option for many database environments. The slave_compressed_protocol parameter tells MySQL to use compression if both master and slave support it. By default, this parameter is disabled.

Starting from MariaDB 10.2.3, selected events in the binary log can be optionally compressed, to save the network transfers.

Replication formats

MySQL offers several replication modes. Choosing the right replication format helps to minimize the time to pass data between the cluster nodes.

Multimaster Replication For High Availability

Some applications can not afford to operate on outdated data.

In such cases, you may want to enforce consistency across the nodes with synchronous replication. Keeping data synchronous requires an additional plugin, and for some, the best solution on the market for that is Galera Cluster.

Galera cluster comes with wsrep API which is responsible of transmitting transactions to all nodes and executing them according to a cluster-wide ordering. This will block the execution of subsequent queries until the node has applied all write-sets from its applier queue. While it’s a good solution for consistency, you may hit some architectural limitations. The common latency issues can be related to:

  • The slowest node in the cluster
  • Horizontal scaling and write operations
  • Geolocated clusters
  • High Ping
  • Transaction size

The slowest node in the cluster

By design, the write performance of the cluster cannot be higher than the performance of the slowest node in the cluster. Start your cluster review by checking the machine resources and verify the configuration files to make sure they all run on the same performance settings.

Parallelization

Parallel threads do not guarantee better performance, but it may speed up the synchronization of new nodes with the cluster. The status wsrep_cert_deps_distance tells us the possible degree of parallelization. It is the value of the average distance between the highest and lowest seqno values that can be possibly applied in parallel. You can use the wsrep_cert_deps_distance status variable to determine the maximum number of slave threads possible.

Horizontal scaling

By adding more nodes in the cluster, we have fewer points that could fail; however, the information needs to go across multi-instances until it’s committed, which multiplies the response times. If you need scalable writes, consider an architecture based on sharding. A good solution can be a Spider storage engine.

In some cases, to reduce information shared across the cluster nodes, you can consider having one writer at a time. It’s relatively easy to implement while using a load balancer. When you do this manually make sure you have a procedure to change DNS value when your writer node goes down.

Geolocated clusters

Although Galera Cluster is synchronous, it is possible to deploy a Galera Cluster across data centers. Synchronous replication like MySQL Cluster (NDB) implements a two-phase commit, where messages are sent to all nodes in a cluster in a 'prepare' phase, and another set of messages are sent in a 'commit' phase. This approach is usually not suitable for geographically disparate nodes, because of the latencies in sending messages between nodes.

High Ping

Galera Cluster with the default settings does not handle well high network latency. If you have a network with a node that shows a high ping time, consider changing evs.send_window and evs.user_send_window parameters. These variables define the maximum number of data packets in replication at a time. For WAN setups, the variable can be set to a considerably higher value than the default value of 2. It’s common to set it to 512. These parameters are part of wsrep_provider_options.

--wsrep_provider_options="evs.send_window=512;evs.user_send_window=512"

Transaction size

One of the things you need to consider while running Galera Cluster is the size of the transaction. Finding the balance between the transaction size, performance and Galera certification process is something you have to estimate in your application. You can find more information about that in the article How to Improve Performance of Galera Cluster for MySQL or MariaDB by Ashraf Sharif.

Load Balancer Causal Consistency Reads

Even with the minimized risk of data latency issues, standard MySQL asynchronous replication cannot guarantee consistency. It is still possible that the data is yet not replicated to slave while your application is reading it from there. Synchronous replication can solve this problem, but it has architecture limitations and may not fit your application requirements (e.g., intensive bulk writes). So how to overcome it?

The first step to avoid stale data reading is to make the application aware of replication delay. It is usually programmed in application code. Fortunately, there are modern database load balancers with the support of adaptive query routing based on GTID tracking. The most popular are ProxySQL and Maxscale.

ProxySQL 2.0

ProxySQL Binlog Reader allows ProxySQL to know in real time which GTID has been executed on every MySQL server, slaves and master itself. Thanks to this, when a client executes a reads that needs to provide causal consistency reads, ProxySQL immediately knows on which server the query can be executed. If for whatever reason the writes were not executed on any slave yet, ProxySQL will know that the writer was executed on master and send the read there.

Maxscale 2.3

MariaDB introduced casual reads in Maxscale 2.3.0. The way it works it’s similar to ProxySQL 2.0. Basically when causal_reads are enabled, any subsequent reads performed on slave servers will be done in a manner that prevents replication lag from affecting the results. If the slave has not caught up to the master within the configured time, the query will be retried on the master.

ClusterControl Tips & Tricks - Dealing with MySQL Long Running Queries

$
0
0

Long running queries/statements/transactions are sometimes inevitable in a MySQL environment. In some occasions, a long running query could be a catalyst to a disastrous event. If you care about your database, optimizing query performance and detecting long running queries must be performed regularly. Things do get harder though when multiple instances in a group or cluster are involved.

When dealing with multiple nodes, the repetitive tasks to check every single node is something that we have to avoid. ClusterControl monitors multiple aspects of your database server, including queries. ClusterControl aggregates all the query-related information from all nodes in the group or cluster to provide a centralized view of workload. Right there is a great way to understand your cluster as a whole with minimal effort.

In this blog post, we show you how to detect MySQL long running queries using ClusterControl.

Why a Query Takes Longer Time?

First of all, we have to know the nature of the query, whether it is expected to be a long running or a short running query. Some analytic and batch operations are supposed to be long running queries, so we can skip those for now. Also, depending on the table size, modifying table structure with ALTER command can be a long running operation.

For a short-span transaction, it should be executed as fast as possible, usually in a matter of subsecond. The shorter the better. This comes with a set of query best-practice rules that users have to follow, like use proper indexing in WHERE or JOIN statement, using the right storage engine, picking proper data types, scheduling the batch operation during off-peak hours, offloading analytical/reporting traffic to dedicated replicas, and so on.

There are a number of things that may cause a query to take longer time to execute:

  • Inefficient query - Use non-indexed columns while lookup or joining, thus MySQL takes longer time to match the condition.
  • Table lock - The table is locked, by global lock or explicit table lock when the query is trying to access it.
  • Deadlock - A query is waiting to access the same rows that are locked by another query.
  • Dataset does not fit into RAM - If your working set data fits into that cache, then SELECT queries will usually be relatively fast.
  • Suboptimal hardware resources - This could be slow disks, RAID rebuilding, saturated network etc.
  • Maintenance operation - Running mysqldump can bring huge amounts of otherwise unused data into the buffer pool, and at the same time the (potentially useful) data that is already there will be evicted and flushed to disk.

The above list emphasizes it is not only the query itself that causes all sorts of problems. There are plenty of reasons which require looking at different aspects of a MySQL server. In some worse-case scenario, a long running query could cause a total service disruption like server down, server crash and connections maxing out. If you see a query takes longer than usual to execute, do investigate it.

How to Check?

PROCESSLIST

MySQL provides a number of built-in tools to check the long running transaction. First of all, SHOW PROCESSLIST or SHOW FULL PROCESSLIST commands can expose the running queries in real-time. Here is a screenshot of ClusterControl Running Queries feature, similar to SHOW FULL PROCESSLIST command (but ClusterControl aggregates all the process into one view for all nodes in the cluster):

As you can see, we can immediately see the offensive query right away from the output. But how often do we stare at those processes? This is only useful if you are aware of the long running transaction. Otherwise, you wouldn't know until something happens - like connections are piling up, or the server is getting slower than usual.

Slow Query Log

Slow query log captures slow queries (SQL statements that take more than long_query_time seconds to execute), or queries that do not use indexes for lookups (log_queries_not_using_indexes). This feature is not enabled by default and to enable it simply set the following lines and restart the MySQL server:

[mysqld]
slow_query_log=1
long_query_time=0.1
log_queries_not_using_indexes=1

The slow query log can be used to find queries that take a long time to execute and are therefore candidates for optimization. However, examining a long slow query log can be a time-consuming task. There are tools to parse MySQL slow query log files and summarize their contents like mysqldumpslow, pt-query-digest or ClusterControl Top Queries.

ClusterControl Top Queries summarizes the slow query using two methods - MySQL slow query log or Performance Schema:

You can easily see a summary of the normalized statement digests, sorted based on a number of criteria:

  • Host
  • Occurrences
  • Total execution time
  • Maximum execution time
  • Average execution time
  • Standard deviation time

We have covered this feature in great detail in this blog post, How to use the ClusterControl Query Monitor for MySQL, MariaDB and Percona Server.

Performance Schema

Performance Schema is a great tool available for monitoring MySQL Server internals and execution details at a lower level. The following tables in Performance Schema can be used to find slow queries:

  • events_statements_current
  • events_statements_history
  • events_statements_history_long
  • events_statements_summary_by_digest
  • events_statements_summary_by_user_by_event_name
  • events_statements_summary_by_host_by_event_name

MySQL 5.7.7 and higher includes the sys schema, a set of objects that helps DBAs and developers interpret data collected by the Performance Schema into more easily understandable form. Sys schema objects can be used for typical tuning and diagnosis use cases.

ClusterControl provides advisors, which are mini-programs that you can write using ClusterControl DSL (similar to JavaScript) to extend the ClusterControl monitoring capabilities custom to your needs. There are a number of scripts included based on Performance Schema that you can use to monitor query performance like I/O wait, lock wait time and so on. For example under Manage -> Developer Studio, go to s9s -> mysql -> p_s -> top_tables_by_iowait.js and click "Compile and Run" button. You should see the output under Messages tab for top 10 tables sorted by I/O wait per server:

There are a number of scripts that you can use to understand low-level information where and why the slowness happens like top_tables_by_lockwait.js, top_accessed_db_files.js and so on.

ClusterControl - Detecting and alerting upon long running queries

With ClusterControl, you will get additional powerful features that you won't find in the standard MySQL installation. ClusterControl can be configured to proactively monitor the running processes, and raise an alarm and send notification to the user if long query threshold is exceeded. This can be configured by using the Runtime Configuration under Settings:

For pre1.7.1, the default value for query_monitor_alert_long_running_query is false. We encourage user to enable this by setting it to 1 (true). To make it persistent, add the following line into /etc/cmon.d/cmon_X.cnf:

query_monitor_alert_long_running_query=1
query_monitor_long_running_query_ms=30000

Any changes made in the Runtime Configuration is applied immediately and no restart required. You will see something like this under the Alarms section if a query exceeds 30000ms (30 seconds) thresholds:

If you configure the mail recipient settings as "Deliver" for the DbComponent plus CRITICAL severity category (as shown in the following screenshot):

You should get a copy of this alarm in your email. Otherwise, it can be forwarded manually by clicking on the "Send Email" button.

Furthermore, you can filter out any kind of processlist resources that match certain criteria with regular expression (regex). For example, if you want ClusterControl to detect long running query for three MySQL users called 'sbtest', 'myshop' and 'db_user1', the following should do:

Any changes made in the Runtime Configuration is applied immediately and no restart required.

Additionally, ClusterControl will list out all deadlock transactions together with the InnoDB status when it was happening under Performance -> Transaction Log:

This feature is not enabled by default, due to deadlock detection will affect CPU usage on database nodes. To enable it, simply tick the "Enable Transaction Log" checkbox and specify the interval that you want. To make it persistent, add variable with value in seconds inside /etc/cmon.d/cmon_X.cnf:

db_deadlock_check_interval=30

Similarly, if you want to check out the InnoDB status, simply go to Performance -> InnoDB Status, and choose the MySQL server from the dropdown. For example:

There we go - all the required information is easily retrievable in a couple of clicks.

Summary

Long running transactions could lead to performance degradation, server down, connections maxed out and deadlocks. With ClusterControl, you can detect long running queries directly from the UI, without the need to examine every single MySQL node in the cluster.

Viewing all 568 articles
Browse latest View live